
Monthly Market Commentary - March 2024
Monthly Market Commentary - March 2024
Market Update
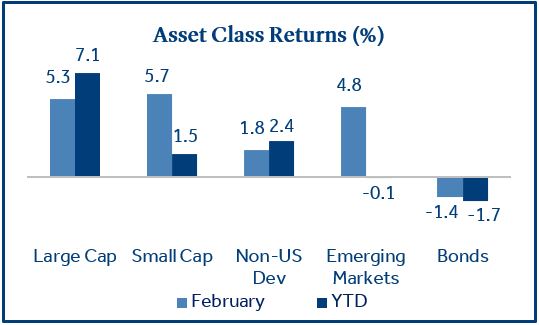
U.S. small cap stocks led strong equity returns in February.
Equities continued their upward momentum as the S&P 500 registered a positive return in 15 out of 17 weeks since late October and hit a fresh all-time high in February.
- U.S. stocks rally broadly in March: Small cap stocks (Russell 2000 Index) returned +5.7% and outperformed large cap stocks (S&P 500 Index) which returned +5.3%. Small caps tend to be more economically sensitive compared to large caps and recent outperformance may be a sign of growing optimism.
- Bonds retreat on hotter than expected inflation: Bonds (Bloomberg US Aggregate Bond Index) declined -1.4% as higher prices for consumers raised concerns the Fed may not budge on rates until mid-year; the 10-year Treasury yield rose +0.26% in February.
- Non-U.S. stocks led by rebound in China: Emerging Markets Stocks (MSCI EM Index) returned +4.8%; and outperformed developed market stocks (MSCI EAFE Index) which returned +1.8%. Chinese equities recovered from their recent selloff and returned +8.4%.
Corporate Earnings
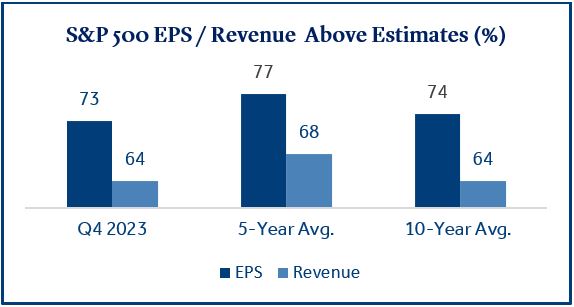
With most S&P 500 firms reporting, results were strong enough to support the recent rally in stocks.
Fourth quarter corporate earnings expectations were muted as many investors expected macroeconomic headwinds to weigh on corporate profits. However, declining input costs, as well as expense reductions, translated to margin expansion for many firms.
- Earnings broadly outperform estimates: 97% of S&P 500 companies have reported results; 73% of these firms reported a positive earnings surprise and 64% reported a positive revenue surprise. The percentage of positive earnings and revenue surprises were below the five-year average1.
- Mega cap stocks exceed expectations: Strong earnings for mega cap stocks stood out during fourth quarter reporting as the top six stocks measured by market capitalization (Microsoft, Apple, NVIDIA, Amazon, Alphabet, and Meta) averaged year-over-year earnings growth of 118%, versus 3.8% for the S&P 5002.
- Equity valuations remain above long-term averages: The trailing twelve-month price-to-earnings (P/E) ratio for the S&P 500 currently sits at 24.2, which is above the 5-year average of 22.3. P/E ratios are lower on a forward-looking basis (20.4) but are still above the five-year average (19.0)3.
Commercial Real Estate
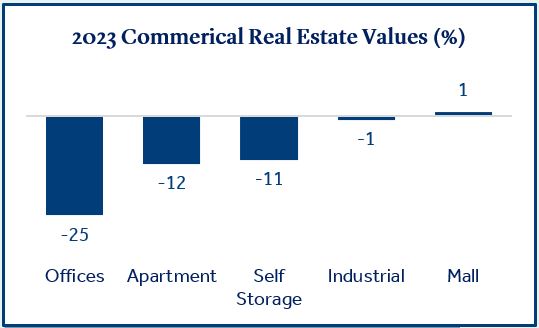
Commercial real estate markets brace for higher default rates over the next couple of years.
The pandemic-induced remote work environment has led to a decline in commercial real estate (CRE) property values. Compounding the issue is higher interest rates which make it more expensive for borrowers to refinance loans, which could lead to elevated default rates.
- The Fed reports weakness in office and multifamily: January FOMC meeting minutes stated CRE property values continued to decline, especially in the office and multifamily sectors, and low levels of transactions likely indicate prices do not currently reflect weaker fundamentals.
- NY Community Bancorp (NYCB) teeters after earnings: NYCB was widely publicized in February as the stock price declined -25% on the heels of the bank reporting a $552 million loss related to failed CRE loans.
- Regional banks under watch for real estate exposure: Banks face $560 billion in CRE loan maturities by the end of 2025 and it is estimated these loans account for 29% of assets at regional banks, compared to 7% at larger banks4. Uncertainty surrounding CRE property values and the potential for rising defaults may put regional banks back in the spotlight following a series of closures in 2023.
U.S. Economy
Labor market strength continued to support the soft-landing narrative for the U.S. economy.
The U.S. economy has been resilient in early 2024 even as short-term lending rates are near 20-year highs. Nonfarm payroll gains in January were the highest since early 2023 and corporate earnings have remained steady. Retail sales pulled back in January, but the trend continues to be positive. The economy may be providing a welcome backdrop for the Fed to be patient in their battle against inflation.
- Nonfarm payrolls beat estimates: Payrolls increased by 353K for the month, far exceeding estimates of 180K, while the unemployment rate remained at 3.7%. One potential concern could be that average hourly earnings (+4.5% annualized) rose more than forecasted (+4.1%) and may put upward pressure on inflation.
- Retail sales decline following the holidays: Consumer spending fell in January (-0.8%) and was worse than projected (-0.3%). Retail sales were mostly positive in 2023, but the January decline has some investors wondering if U.S. consumers are starting to show signs of fatigue.
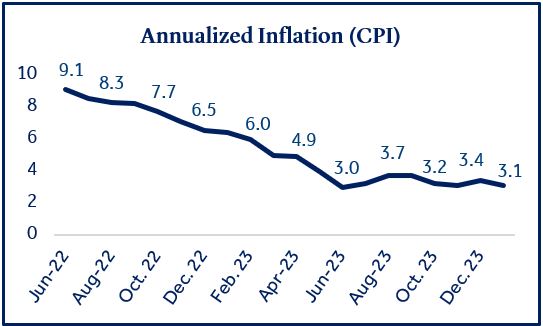
- Inflation (CPI) remains above expectations: Consumer prices rose +3.1% (annualized) in January with the cost of shelter accounting for much of the increase. CPI declined from +3.4% in December, but it was still above expectations (2.9%), and the Fed’s long-term target of 2.0%.
Federal Reserve
Expectations for interest rate cuts decline due to lingering inflation.
Fed Chair Jerome Powell recently warned rate cut talks may be premature and that higher inflation could be stubborn. He went on to say it is prudent for the committee to be patient and wait for the data to confirm inflation is moving down to 2% in a sustainable way.
- Fed encouraged with data in January: The January FOMC meeting minutes indicated the committee was optimistic that policy decisions have been successful combating inflation, and the Fed Funds rate was likely at its peak for the current cycle.
- Fed balance sheet continues to shrink: The Fed reduced the size of its balance sheet post-pandemic from $9 trillion to $7.6 trillion5. Members have hinted that on-going balance sheet reductions may continue even after rate cuts begin.
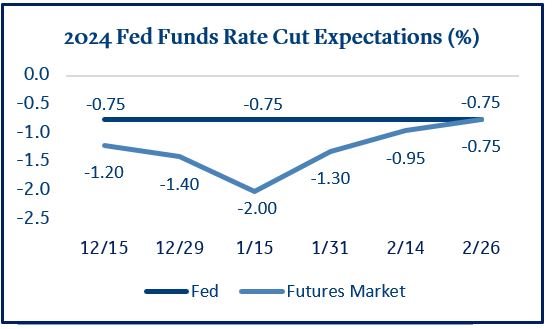
- Fed Funds futures projecting three cuts in 2024: The futures market is now forecasting three rate cuts in 2024 and a Fed Funds rate of 4.50% to 4.75% at year end6. This is a stark contrast to mid-January when futures were pricing in six to eight rate cuts during the year. Since that time, market participants seem to have come to terms with a slower approach to rate cuts from the Fed.
Economic Calendar
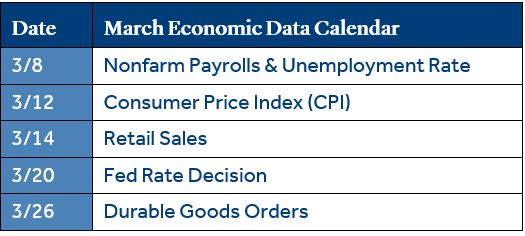
Inflation (CPI) is likely to be in focus in March following back-to-back months above expectations.
- Inflation (CPI) will be closely watched: CPI will be highly scrutinized in mid-March as investors look for clues of a sustainable trend lower in inflation. Although CPI garners most of the headlines, it is worth noting the Fed also pays close attention to Personal Consumption Expenditures (PCE). These two data points are highly correlated, but shelter represents 36% of CPI but only 18% of PCE. The most recent PCE report released February 29 showed prices increased +2.8% annualized; below CPI and in-line with estimates, which could be reassuring to some investors following January CPI.
- Revisions to nonfarm payrolls could be key: Investors will be looking for continued strength in the labor market as this could be the most important factor in a soft-landing scenario for the U.S. economy. January has been a highly adjustable payroll number due to weather and year-end factors. Investors will likely pay close attention to any revisions in the February report.
- The Fed is not expected to lower rates in March: This meeting was highly anticipated in late 2023 and early 2024 as many investors had it targeted for a rate cut. Circumstances have changed since then but anytime the Fed meets it has potential to move markets. The FOMC will also release its updated economic projections at this time.
Data and rates used were indicative of market conditions as of the date shown. Opinions, estimates, forecasts, and statements of financial market trends are based on current market conditions and are subject to change without notice. This material is intended for general public use and is for educational purposes only. By providing this content, Park Avenue Securities LLC is not undertaking to provide any recommendations or investment advice regarding any specific account type, service, investment strategy or product to any specific individual or situation, or to otherwise act in any fiduciary or other capacity. Please contact a financial professional for guidance and information that is specific to your individual situation. Indices are unmanaged and one cannot invest directly in an index. Links to external sites are provided for your convenience in locating related information and services. Guardian, its subsidiaries, agents, and employees expressly disclaim any responsibility for and do not maintain, control, recommend, or endorse third-party sites, organizations, products, or services and make no representation as to the completeness, suitability, or quality thereof. Past performance is not a guarantee of future results.
Asset class returns sourced from Morningstar Direct. Asset categories listed correspond to the following underlying indices: Large Cap (S&P 500), Small Cap (Russell 2000), Non-US Dev (MSCI EAFE), Emerging Markets (MSCI EM), Bonds (Bloomberg US Aggregate Bond), Chinese Equities (MSCI China).
Treasury Yields sourced from the U.S. Department of the Treasury.
Inflation (CPI) sourced from the U.S. Bureau of Labor Statistics.
2023 commercial real estate values sourced from Green Street and Bloomberg. Offices, Apartment, Self-Storage, Industrial, and Mall represent underlying components in the Green Street Commercial Property Price Index.
2024 Fed Funds rate cut expectations sourced from CME FedWatch Tool.
1 Source: FactSet
2 Source: Briefing.com
3 Source: Morningstar Direct
4 Source: Bloomberg
5 Source: Federal Reserve
6 Source: CME FedWatch Tool
The Consumer Price Index (CPI) examines the weighted average of prices of a basket of consumer goods and services, such as transportation, food and medical care and is a commonly used measure of the rate of inflation.
Fund Funds Rate: Short-term target interest rate set by the Federal Open Market Committee (FOMC); the policy making committee of the Federal Reserve. It’s the interest that banks and other depository institutions lend money on an overnight basis.
Retail Sales represents the level of retail sales directly to U.S. consumers.
Durable Goods measure the cost of orders received by U.S. manufacturers of goods meant to last at least three years.
S&P 500 Index: Index is generally considered representative of the stock market as a whole. The index focuses on the large-cap segment of the U.S. equities market.
Russell 2000 Index: Index measures performance of the small-cap segment of the U.S. equity universe.
MSCI EAFE Index: Index measures the performance of the large and mid-cap segments of developed markets, excluding the U.S. & Canada.
MSCI EM Index: Index Measures the performance of the large and mid-cap segments of emerging market equities.
Bloomberg US Aggregate Bond Index: Index measures the performance of investment grade, U.S. dollar-denominated, fixed-rate taxable bond market, including Treasuries, government-related and corporate securities, MBS, ABS, and CMBS.
Park Avenue Securities LLC (PAS) is a wholly owned subsidiary of The Guardian Life Insurance Company of America (Guardian). 10 Hudson Yards, New York, NY 10001. PAS is a registered broker-dealer offering competitive investment products, as well as a registered investment advisor offering financial planning and investment advisory services. PAS is a member of FINRA and SIPC.
2024-170295 (Exp. 03/26)
PAS018159