
Monthly Market Commentary – April 2026
Monthly Market Commentary – April 2026
Market Update
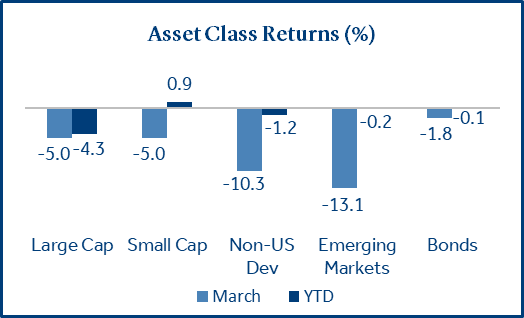
International equities led asset class declines as geopolitical risks intensified, and oil prices surged.
Rising global tensions, higher oil prices, and a jump in interest rates weighed on investor sentiment in March. Stocks and bonds fell as inflation concerns resurfaced and expectations for Fed rate cuts declined, contributing to heightened volatility.
- Rising energy costs and the potential for higher inflation weighed on U.S. stocks: Large cap (S&P 500) and small cap equities (Russell 2000) each declined -5.0% during the month. Persistent inflation pressures increase the risk of higher interest rates, which could raise corporate borrowing costs, stifle growth, and slow consumer spending.
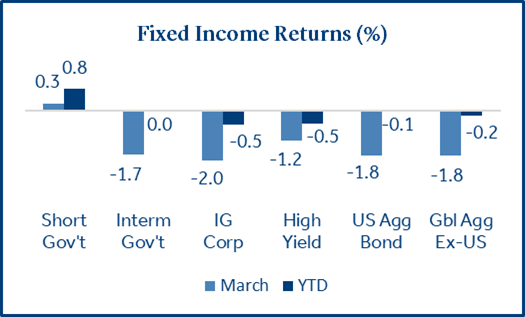
- Treasury yields moved higher as investors adjusted to the prospect of higher inflation: The Bloomberg US Agg Bond Index fell -1.8% as the 10-year Treasury yield rose from 3.97% to 4.30%. Treasuries and mortgage-backed securities lost -1.7% while investment grade corporate bonds declined -2.0%.
- International equities lagged on rising oil prices and a strong U.S. dollar: Developed and emerging markets fell -10.3% and -13.1%, respectively. Europe and Asia are both energy importers (net) which makes them especially vulnerable to rising energy prices. Additionally, international currency declines compounded equity losses for U.S. investors.
Equities
U.S. equities recorded their largest monthly decline since March 2025.
Stocks traded with heightened volatility in March as investors balanced an uncertain economic backdrop of higher oil prices and rising interest rates against resilient corporate earnings growth.
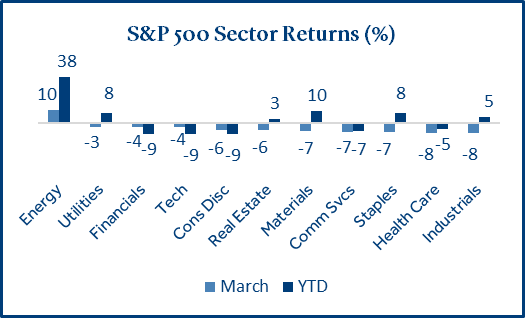
- The energy sector was a bright spot due to rising oil prices: Driven by an oil supply shock in the Middle East and rising demand for power to support AI infrastructure, energy stocks have soared and decoupled from the broader market. Domestic oil producers like Exxon and Chevron rallied sharply as their assets are seen as being insulated from the turmoil in the Middle East.
- Asset heavy sectors posted strong returns during the first quarter: A key trend in early 2026 is the investor rotation into Materials, Energy, Staples and Industrial “MESI” stocks that produce physical goods which could make them less vulnerable to AI-related disruption.
- Investors favored higher yielding sectors as they adopted a more defensive posture: The yield factor (+5.7%) has proved more resilient than the broader market year-to-date. Dividend paying, value-oriented sectors such as energy, utilities, staples, and materials benefited from strong cash flows, pricing power, and exposure to higher commodity prices. Reflecting this shift, value stocks (+2.1%) significantly outperformed growth stocks (-9.8%) in the first quarter.
Fixed Income
Bond returns were mostly negative as interest rates jumped and Fed rate cut expectations faded.
Treasury yields rose across maturities as inflation pressure, higher energy prices, and resilient U.S. economic data reduced expectations for near term Fed rate cuts.
- Longer-term yields rose on signs of sticky inflation: Consumer inflation (CPI) rose 2.4% (annualized), unchanged from January. More concerning for investors was the producer price index (PPI), which measures the change in selling prices for U.S. producers. PPI rose 3.4% year over year, above January (+2.9%) and materially higher than expected (+3.0%).
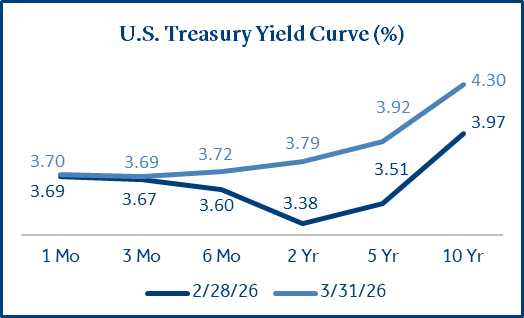
- Interest rate futures indicate the Fed is likely to leave rates unchanged in 2026: Investor expectations for higher rates, due to stubborn inflation and rising energy costs, weighed on bond returns. There is now a 74% probability that the Fed will not cut rates this year. At the beginning of the year, investors had expected two -0.25% rate cuts in 20261
Private Credit
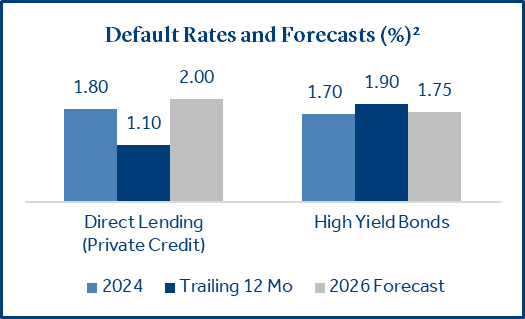
Private credit has been in the spotlight as first quarter investor redemption requests were elevated.
Private credit is a type of debt financing where non-bank lenders provide loans directly to companies. The loans are negotiated privately and often carry higher yields to compensate investors for reduced liquidity. Private credit funds are often structured as semi-liquid interval funds, which limit redemptions to a certain percentage of assets on a periodic basis (e.g., 5% of NAV per quarter).
- Withdrawal limits are designed to protect investors: Recent headlines have highlighted instances where redemption requests have exceeded a fund’s stated quarterly limit (e.g., 5% of NAV). Private credit portfolios consist of loans intended to be held over a long-term time horizon. When redemption requests exceed quarterly limits, the fund advisor determines whether excess redemptions will be satisfied or if the redemption requests will be paid on a pro-rata basis.
- Publicly traded BDCs were under pressure as risk appetite declined: BDCs are closed-end funds that hold non-investment grade loans and offer daily liquidity through shares that can trade at a premium or discount to the NAV (recorded loan values). During Q1, the S&P BDC Index declined ‑10.1%, reflecting increased selling pressures facing the asset class. The selling pressure reflected weaker investor sentiment more so than a change in the underlying credit fundamentals as default expectations have remained relatively stable2.
Geopolitical Events
Tensions in the Middle East have escalated, which has triggered volatility within capital markets.
From an economic perspective, the most significant impact of the Middle Eastern conflict has been the rise in energy prices and the resulting risk of renewed inflationary pressure. Iran’s restrictions on the Strait of Hormuz, which is a major transit route for roughly 20% of the global oil supply, has been a key driver of higher energy prices.
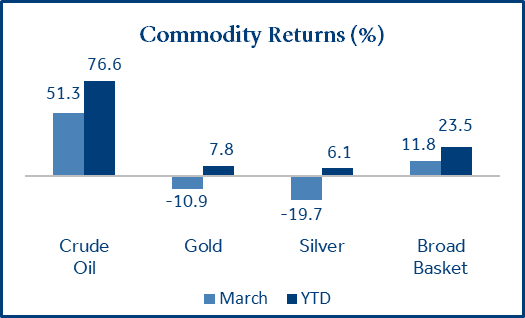
- Rising oil prices reflect geopolitical supply risk rather than demand-driven growth: Higher energy prices could benefit energy producers and commodity-linked assets in the near-term, but they increase the risk of rising inflation, potentially complicating central bank policy and weighing on consumer spending.
- Gold and silver prices fell as rates rose: Rising rates increase the opportunity cost when holding non-yielding assets like gold and silver. Further, the U.S. dollar appreciated in March (+2.4%) which can create headwinds for gold and silver in dollar terms.
- Asian economies could be the hardest hit by higher oil prices: Japan, South Korea, and China import a majority of their oil from the Middle East. Energy accounts for a larger portion of household and corporate spending in these economies, resulting in higher prices for transportation, food, and manufacturing.
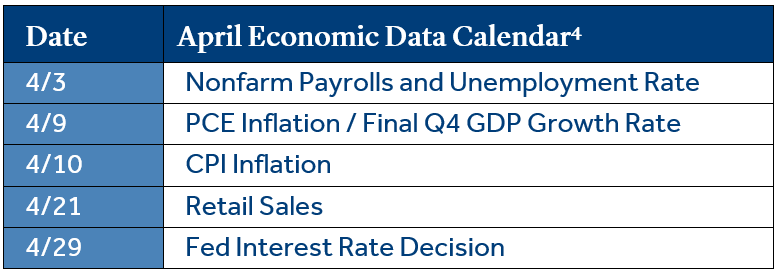
Economic Calendar
Recent economic data provided mixed signals as inflation concerns persisted.
U.S. nonfarm payrolls unexpectedly declined by -92k in February, reversing a +126k gain in January. The weaker reading raised questions about the durability of labor market momentum. At the same time, the Fed’s preferred inflation measure (PCE) remained elevated (+2.8%) and well above their 2.0% target, highlighting the ongoing challenge of balancing slower growth against persistent price pressures.
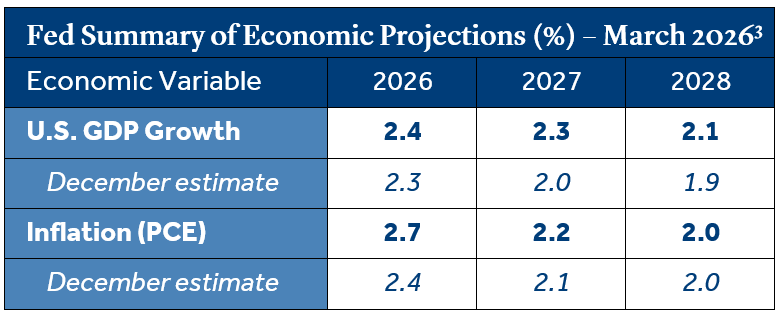
- The Fed raised its GDP growth outlook but increased its inflation forecast: Policymakers pointed to stronger than expected business investment, AI-related productivity gains, and resilient consumer spending as key drivers behind the higher growth projections. However, progress on inflation has been uneven, with officials highlighting upside risks from tariffs and rising energy prices.
- The partial government shutdown could add to near-term uncertainty for the economy: While the direct economic impact is typically modest if short‑lived, a prolonged shutdown could weigh on growth through delayed federal spending, reduced consumer confidence, and disruptions to government data releases that inform business and policy decisions.
To download the printable version, CLICK HERE.
Data and rates used were indicative of market conditions as of the date shown. Opinions, estimates, forecasts, and statements of financial market trends are based on current market conditions and are subject to change without notice. This material is intended for general public use and is for educational purposes only. By providing this content, Park Avenue Securities LLC is not undertaking to provide any recommendations or investment advice regarding any specific account type, service, investment strategy or product to any specific individual or situation, or to otherwise act in any fiduciary or other capacity. Please contact a financial professional for guidance and information that is specific to your individual situation. Indices are unmanaged and one cannot invest directly in an index. Links to external sites are provided for your convenience in locating related information and services. Guardian, its subsidiaries, agents, and employees expressly disclaim any responsibility for and do not maintain, control, recommend, or endorse third-party sites, organizations, products, or services and make no representation as to the completeness, suitability, or quality thereof. Past performance is not a guarantee of future results.
All investments involve risks, including possible loss of principal. Equities may decline in value due to both real and perceived general market, economic, and industry conditions. Fixed income securities involve interest rate, credit, inflation, and reinvestment risks, and possible loss of principal. As interest rates rise, the value of fixed income securities falls. Low-rated, high yield bonds are subject to greater price volatility. Investing in securities of smaller companies tends to be more volatile and less liquid than securities of larger companies. Investing in foreign securities may involve heightened risk including currency fluctuations, less liquid trading markets, greater price volatility, political and economic instability, less publicly available information and changes in tax or currency laws. Such risks are enhanced in emerging markets.
Asset class returns sourced from Morningstar Direct. Asset categories listed correspond to the following underlying indices: Large Cap (S&P 500), Small Cap (Russell 2000), Non-US Dev (MSCI EAFE), Emerging Markets (MSCI EM), Bonds (Bloomberg US Aggregate Bond), Short Gov’t (Bloomberg Short Treasury), Interm Gov’t (Bloomberg US Treasury), IG Corp (Bloomberg US Corp. Bond), High Yield (Bloomberg High Yield Corporate), Global Agg ex-US (Bloomberg Global Agg Ex US – Hedged), Tech Sector (S&P 500 Information Technology), S&P BDC Index (S&P Business Development Company Index), Crude Oil (DJ Commodity Crude Oil), Gold (DJ Commodity Gold), Silver (DJ Commodity Silver), Broad Basket (DJ Commodity)
Treasury Yields sourced from the U.S. Department of the Treasury.
Nonfarm payrolls, unemployment statistics, and inflation (CPI) are sourced from the Department of Labor.
1 Source: CME FedWatch Tool
2 Source: Mercer – KBRA DLD Default Research. Trailing 12 months is through February 16, 2026. Direct Lending results are pending Q4 BDC holdings.
3 Source: Federal Reserve Board
4 Source: Bloomberg. There has been an elevated number of delays in scheduled release dates since the government shutdown in Q4 2025.
The Consumer Price Index (CPI) examines the weighted average of prices of a basket of consumer goods and services, such as transportation, food, and medical care, and is a commonly used measure of the rate of inflation.
Retail Sales represents the level of retail sales directly to U.S. consumers.
Fed Funds Rate: Short-term target interest rate set by the Federal Open Market Committee (FOMC); the policy making committee of the Federal Reserve. It is the interest that banks and other depository institutions lend money on an overnight basis.
S&P 500 Index: Index is generally considered representative of the stock market as a whole. The index focuses on the large-cap segment of the U.S. equities market.
Russell 2000 Index: Index measures performance of the small-cap segment of the U.S. equity universe.
MSCI EAFE Index: Index measures the performance of the large and mid-cap segments of developed markets, excluding the U.S. & Canada.
MSCI EM Index: Index Measures the performance of the large and mid-cap segments of emerging market equities.
Bloomberg US Aggregate Bond Index: Index measures the performance of investment grade, U.S. dollar-denominated, fixed-rate taxable bond market, including Treasuries, government-related and corporate securities, MBS, ABS, and CMBS.
Park Avenue Securities LLC (PAS) is a wholly owned subsidiary of The Guardian Life Insurance Company of America (Guardian). 10 Hudson Yards, New York, NY 10001. PAS is a registered broker-dealer offering competitive investment products, as well as a registered investment advisor offering financial planning and investment advisory services. PAS is a member of FINRA and SIPC.
PAS018119
7069921.23 (Exp. 3/28)