
Monthly Market Commentary – August 2025
Monthly Market Commentary – August 2025
Market Update
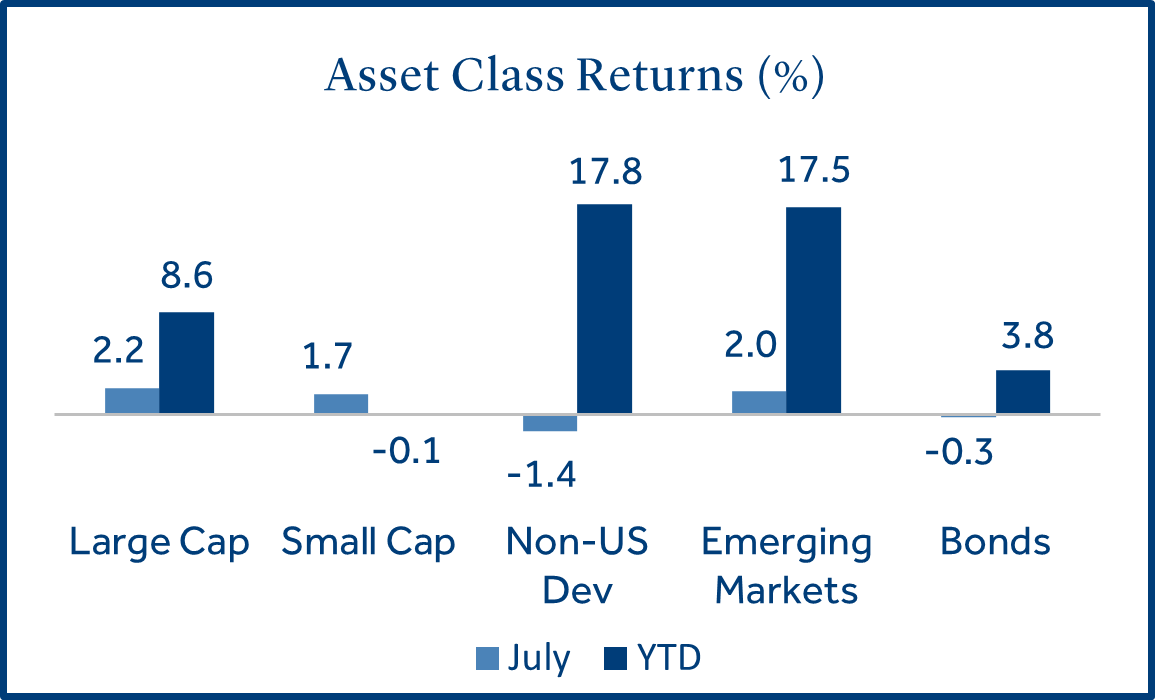
U.S. stocks posted solid gains in July on trade optimism and better than expected economic data.
The S&P 500 rebounded to a new all-time high in July, recovering from a sharp contraction earlier in the year. The mid-year rally in stocks has been driven by positive trade policy developments, better than expected corporate earnings, and continued strength in the labor market. Against this backdrop:
- U.S. large cap stocks were boosted by the magnificent seven: Large caps (S&P 500 Index) gained +2.2% and topped small cap stocks (Russell 2000 Index) which returned +1.7%. Amazon, Alphabet, Apple, Microsoft, Meta, NVIDIA, and Tesla collectively returned +5.6% as investors focused on solid earnings and growth in Artificial Intelligence (AI).
- Bond prices declined modestly as interest rates rose: Bonds (Bloomberg U.S. Aggregate Bond Index) declined -0.3% as the 10-year Treasury yield increased from 4.24% to 4.37%. Investment grade corporate bonds gained +0.1% and outperformed mortgage-backed securities (-0.4%) and U.S. Treasuries (-0.4%).
- Emerging market equities topped non-US developed markets: Emerging market stocks (MSCI EM Index) gained +2.0% and topped non-U.S. developed markets (MSCI EAFE Index) which declined -1.4%. Chinese stocks (+4.8%) boosted emerging markets on hopes of additional economic stimulus.
Equities
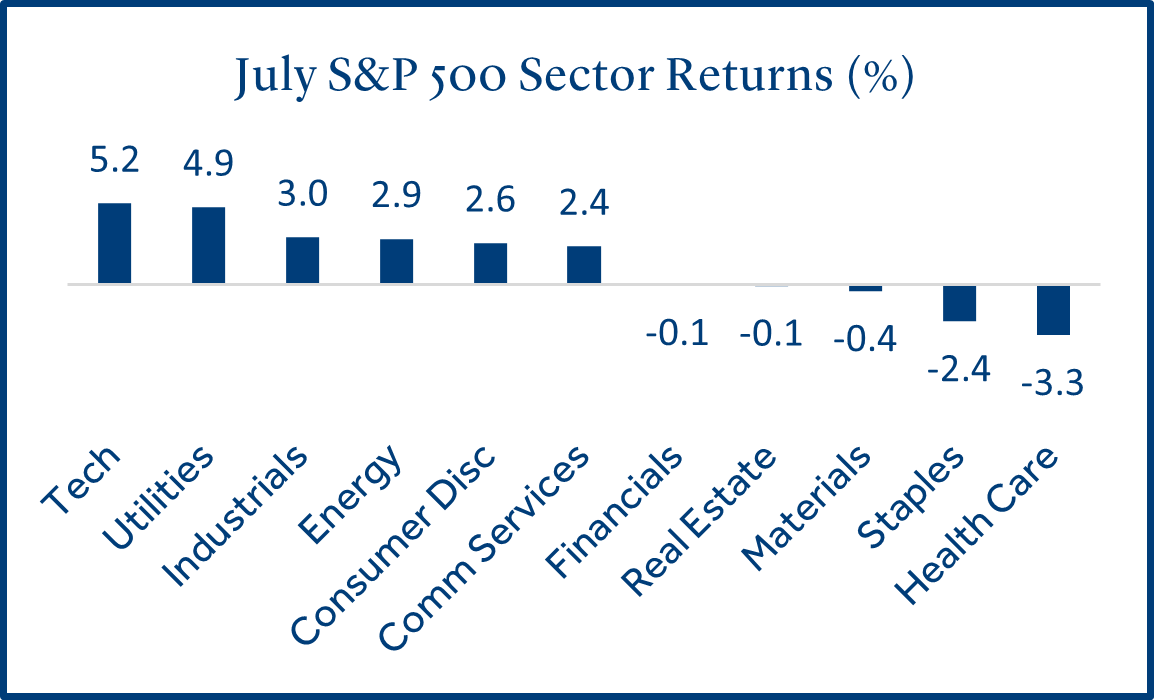
Technology stocks continued to march higher as corporate earnings beat expectations.
Domestic stocks rallied for the third consecutive month on optimism around U.S. trade policy and better than feared corporate earnings.
- Corporate earnings have largely exceeded forecasts: 66% of firms in the S&P 500 have reported financial results for Q2 2025. 82% have reported earnings-per-share results above estimates, which are above the 5- and 10-year average1. The strong results may have provided relief to investors given the uncertainty around tariffs and the geopolitical environment.
- Small cap stocks lagged for much of 2025 but have performed well in recent months: Positive developments for small caps include a possible rate cut in September and potential benefits from recent tax legislation. Small caps tend to carry higher debt loads compared to large caps and lower rates translate into lower financing costs. Additionally, tax code changes to interest expense could result in larger deductions that boost profits for small caps.
- Technology stocks led the S&P 500 higher for the fourth consecutive month: Continued demand for AI related products and services supported further growth in the tech sector. Alphabet (Google), Amazon, Meta Platforms (Facebook), and Microsoft plan to spend nearly $400 billion in 2025 to build out AI infrastructure.
Fixed Income
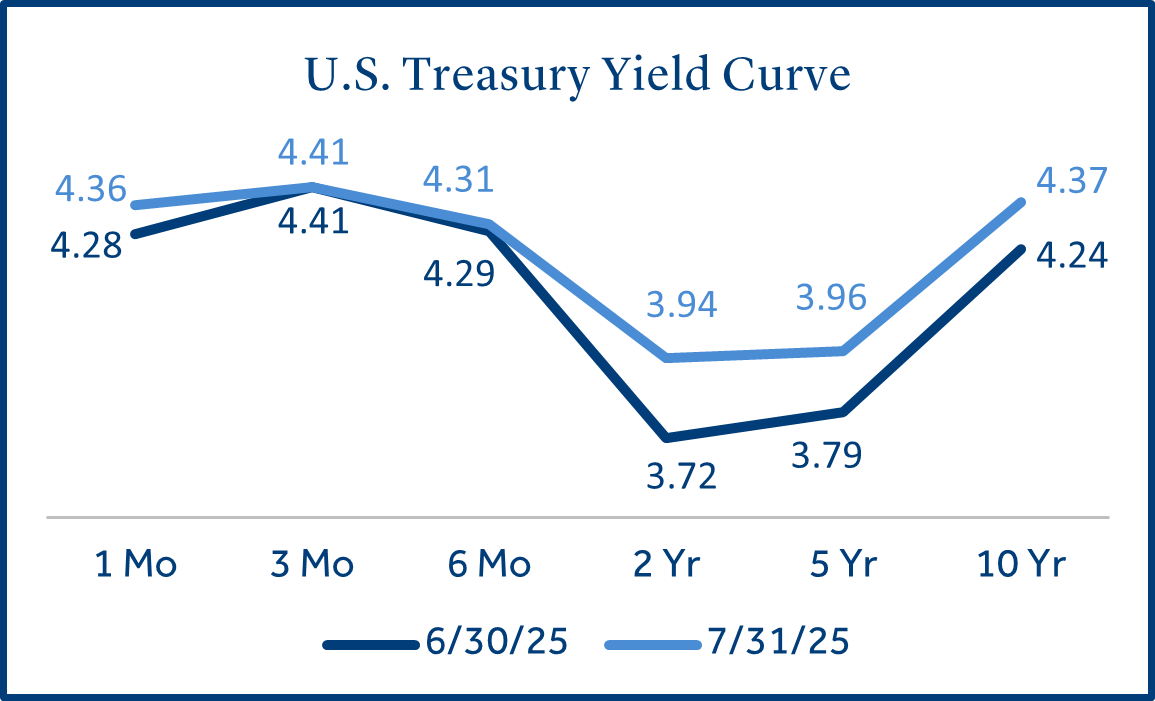
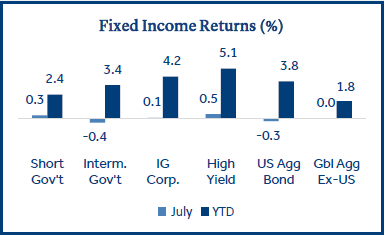
Bond returns were strong as conflict in the Middle East contributed to demand.
Treasury yields rose in July as inflation ticked higher and the Federal Reserve (Fed) left short-term rates unchanged. The 10-year Treasury yield has traded in a range of 4.0 – 4.5% since early April as investors seek clarity on trade policy, the Fed, and the direction of the U.S. economy.
- Long-term rates rose more than short-term rates: Longer-term yields increased in part due to higher inflation in recent months, a longer than expected pause in rate cuts from the Fed, and growing concerns about the U.S. budget deficit.
- High yield (HY) corporate bonds topped fixed income returns in July: HY bonds benefitted from less interest rate sensitivity and higher yields compared to other bond sectors. However, credit spreads (the yield premium compared to a Treasury bond of the same maturity) are near 20-year lows, an indication investor risk appetite has increased.
Tariffs
The U.S. made several key trade agreements in July prior to the President’s August 1st deadline.
The U.S. reached key trade deals with the European Union (EU), Japan, Vietnam, and South Korea in July. In each case, the agreed upon tariff rate was below the “reciprocal tariff” rate announced in early April, but above the 10% baseline rate set during the negotiation period.
- Multiple trade deals have been reached, but several remain unsettled: Mexico and Canada rank 2nd and 3rd in terms of total trade dollars with the U.S (behind the EU) and deals have not been reached. China accounts for the largest U.S. trade deficit and has an August 12th deadline to reach a new deal. However, many analysts expect a 90-day extension for China2.
- Inflation has ticked higher in recent months, suggesting tariffs have had an impact: Tariff costs are often passed on to consumers by businesses to lessen the impact on profitability. CPI inflation increased +2.7% (annualized) in June, well above May (+2.4%). Although the increase was in line with forecasts, it was the second consecutive monthly increase and the highest annual rate since February.
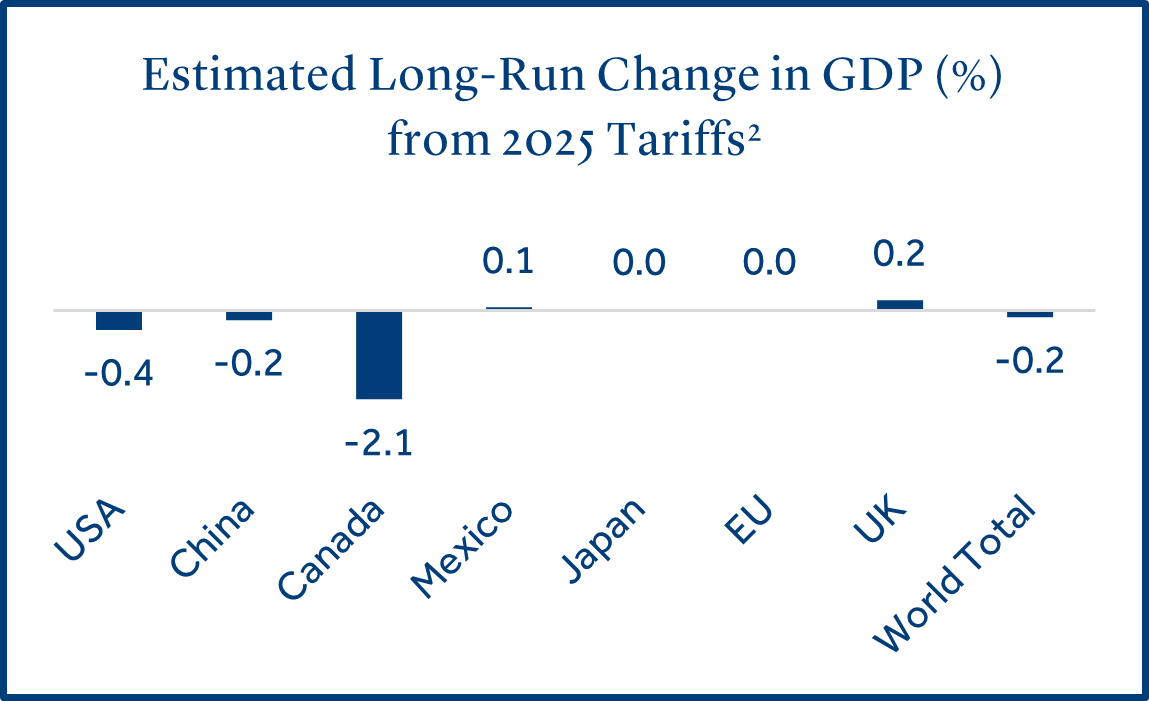
- Tariffs boosted U.S. revenue in 2025: The U.S. Treasury estimated that tariff revenue may reach $300 billion in 2025 (compared to $80 billion in 2024). However, importers will absorb a portion of the cost which will likely affect future economic growth. Tariffs are expected to lower overall GDP growth in the U.S. by -0.8% in 2025 and -0.4% longer term3.
U.S. Tax Bill
New tax bill makes expiring tax cuts permanent and introduces new, temporary deductions.
The legislation is designed to expand tax relief to individuals and businesses, with a focus on middle-income households and economic growth.
- The tax and spending bill could be additive to GDP growth: For individuals, the standard deduction was increased to $15,750 for single filers and $31,500 for joint filers, while the child tax credit rose to $2,200 per qualifying child. A new $6,000 deduction was introduced for taxpayers over age 65 and the deduction cap on state and local tax (SALT) was temporarily raised to $40,000 but phases out at higher income levels. Additional provisions include deductions for qualified tip income and overtime pay, both subject to income limits. For businesses, the corporate income tax rate remains at 21%, the bill reinstates 100% bonus depreciation and restores full and immediate deductibility of domestic R&D expenses which could provide a pro-growth boost to the U.S. economy.
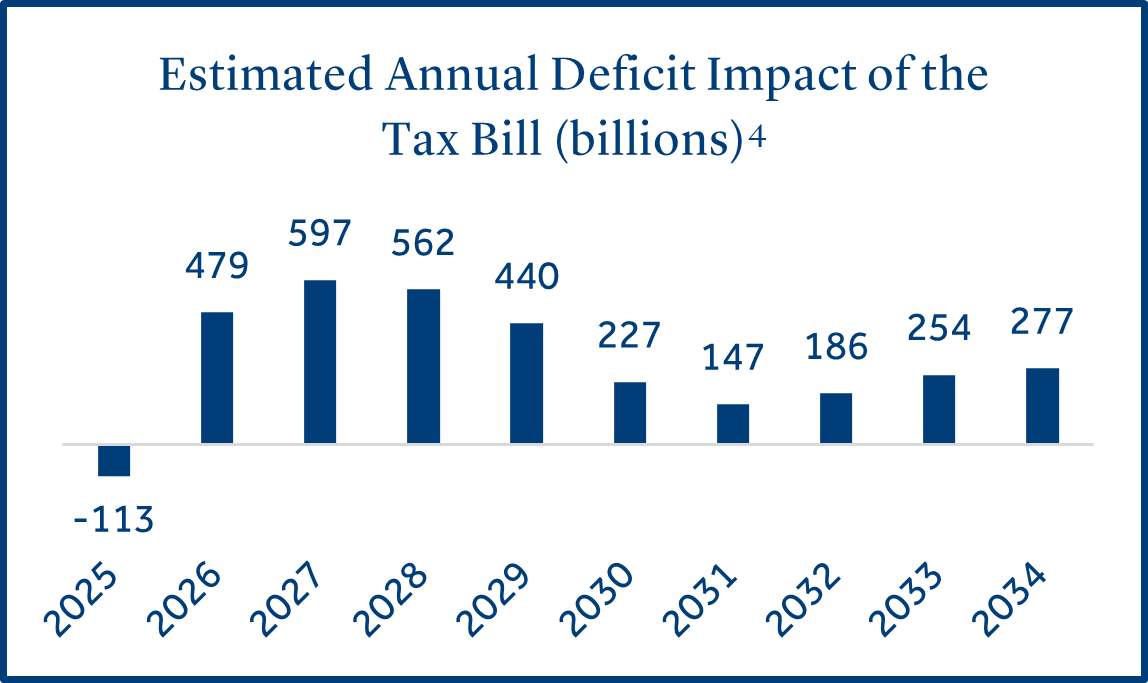
- The Congressional Budget Office stated the tax bill will lead to a higher U.S. budget deficit: The increase in government spending and tax cuts for individuals and businesses is projected to add over three trillion dollars to the U.S. budget deficit over the next 10 years4. The bill could push the deficit-to-GDP ratio to more than 7%5 by 2026, well above the 50-year average of 3.8%.
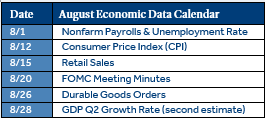
Economic Calendar
U.S. economic growth rebounded while the labor market remained resilient.
The U.S. economy showed signs of recovery in July as second quarter gross domestic product (GDP) rose by +3.0% (annualized), following the -0.5% contraction in Q1. The labor market continued to be resilient as applications for unemployment declined for the fifth consecutive week to the lowest level since mid-April.
- Job growth has been resilient but moderated in July: Nonfarm payrolls increased by +147k in June, well above the forecast (+110k) as state and local government jobs posted a large gain. However, July nonfarm payrolls (reported on August 1st) were +73k, below the forecast of +104k. Additionally, job growth for May and June was revised lower.
- June retail sales were strong following a sharp decline in May: Consumer spending increased by +0.6% in June following a -0.9% decline in May. Economists were expecting an increase in sales of +0.1%. The report was strong overall and tempered concerns the U.S. consumer had weakened and pulled back spending due to tariffs.
- As expected, the Fed left short-term rates unchanged at their July policy meeting: The Fed has been slower to cut interest rates than expected early in the year. The committee continued to take a “wait and see” approach as they digest further information on how tariffs have affected inflation and economic growth. Interest rate futures reflected a 60% probability the Fed will cut rates by -0.25% at their next meeting in September6.
To download the printable version, CLICK HERE.
Data and rates used were indicative of market conditions as of the date shown. Opinions, estimates, forecasts, and statements of financial market trends are based on current market conditions and are subject to change without notice. This material is intended for general public use and is for educational purposes only. By providing this content, Park Avenue Securities LLC is not undertaking to provide any recommendations or investment advice regarding any specific account type, service, investment strategy or product to any specific individual or situation, or to otherwise act in any fiduciary or other capacity. Please contact a financial professional for guidance and information that is specific to your individual situation. Indices are unmanaged and one cannot invest directly in an index. Links to external sites are provided for your convenience in locating related information and services. Guardian, its subsidiaries, agents, and employees expressly disclaim any responsibility for and do not maintain, control, recommend, or endorse third-party sites, organizations, products, or services and make no representation as to the completeness, suitability, or quality thereof. Past performance is not a guarantee of future results.
All investments involve risks, including possible loss of principal. Equities may decline in value due to both real and perceived general market, economic, and industry conditions. Fixed income securities involve interest rate, credit, inflation, and reinvestment risks, and possible loss of principal. As interest rates rise, the value of fixed income securities falls. Low-rated, high yield bonds are subject to greater price volatility. Investing in securities of smaller companies tends to be more volatile and less liquid than securities of larger companies. Investing in foreign securities may involve heightened risk including currency fluctuations, less liquid trading markets, greater price volatility, political and economic instability, less publicly available information and changes in tax or currency laws. Such risks are enhanced in emerging markets.
Asset class returns sourced from Morningstar Direct. Asset categories listed correspond to the following underlying indices: Large Cap (S&P 500), Small Cap (Russell 2000), Non-US Dev (MSCI EAFE), Emerging Markets (MSCI EM), Bonds (Bloomberg US Aggregate Bond), Short Gov’t (Bloomberg Short Treasury), Interm Gov’t (Bloomberg US Treasury), IG Corp (Bloomberg US Corp. Bond), High Yield (Bloomberg High Yield Corporate), Global Agg ex-US (Bloomberg Global Agg Ex US – Hedged).
Treasury Yields sourced from the U.S. Department of the Treasury.
Inflation (CPI) sourced from the U.S. Bureau of Labor Statistics.
Unemployment statistics sourced from the Department of Labor.
1 Source: FactSet
2 Source: Reuters
3 Source: Budget Lab at Yale
4 Source: The Congressional Budget Office
5 Source: Morgan Stanley
6 Source: CME FedWatch Tool ( as of 7/31/25)
The Consumer Price Index (CPI) examines the weighted average of prices of a basket of consumer goods and services, such as transportation, food, and medical care, and is a commonly used measure of the rate of inflation.
Retail Sales represents the level of retail sales directly to U.S. consumers.
Durable Goods measure the cost of orders received by U.S. manufacturers of goods meant to last at least three years.
Fed Funds Rate: Short-term target interest rate set by the Federal Open Market Committee (FOMC); the policy making committee of the Federal Reserve. It is the interest that banks and other depository institutions lend money on an overnight basis.
S&P 500 Index: Index is generally considered representative of the stock market as a whole. The index focuses on the large-cap segment of the U.S. equities market.
Russell 2000 Index: Index measures performance of the small-cap segment of the U.S. equity universe.
MSCI EAFE Index: Index measures the performance of the large and mid-cap segments of developed markets, excluding the U.S. & Canada.
MSCI EM Index: Index Measures the performance of the large and mid-cap segments of emerging market equities.
Bloomberg US Aggregate Bond Index: Index measures the performance of investment grade, U.S. dollar-denominated, fixed-rate taxable bond market, including Treasuries, government-related and corporate securities, MBS, ABS, and CMBS.
Park Avenue Securities LLC (PAS) is a wholly owned subsidiary of The Guardian Life Insurance Company of America (Guardian). 10 Hudson Yards, New York, NY 10001. PAS is a registered broker-dealer offering competitive investment products, as well as a registered investment advisor offering financial planning and investment advisory services. PAS is a member of FINRA and SIPC.
7069921.14 (Exp. 7/27)