
Monthly Market Commentary - June 2024
Monthly Market Commentary - June 2024
Market Update
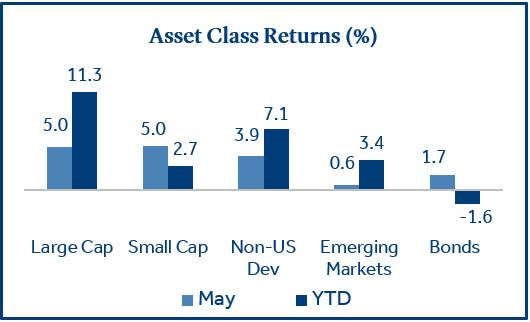
Equity and fixed income markets delivered strong returns in May.
Stocks and bonds both rebounded in May after suffering declines in April. The equity rally was broad-based across domestic large cap, small cap, and non-U.S. stocks as corporate earnings were better than expected, while bonds benefited from declining Treasury yields.
- Large and small cap stocks rallied in May: Large cap (S&P 500 Index) and small cap stocks (Russell 2000 Index) each gained 5.0% during the month. Earnings from large cap technology companies laid the foundation for stocks to advance as Apple and NVIDIA posted strong financial results.
- Bonds posted their best monthly return of the year: Bonds (Bloomberg US Aggregate Bond Index) returned 1.7% as the Federal Reserve (the “Fed”) stated it will slow the pace at which maturing bonds roll off its balance sheet (i.e., quantitative tightening), which sent Treasury yields lower.
- Non-US stocks post strong performance: Non-U.S. developed market stocks (MSCI EAFE Index) returned 3.9% and outperformed Emerging Markets stocks (MSCI EM Index) which gained 0.6%. European stocks (+4.8%) boosted developed market returns on the possibility the European Central Bank (ECB) will lower short-term interest rates in June.
U.S. Equities
First quarter corporate earnings were better than anticipated, which helped push stocks higher in May.
Stocks posted strong returns in May as corporate earnings results outweighed fears the Fed might delay rate cuts until later in the year.
- First quarter earnings results outperformed long-term averages: At the end of May, 96% of S&P 500 firms had reported first quarter financial results. 78% of reporting firms posted earnings above estimates, which beat the 5-year (77%) and 10-year averages (74%)1.
- Technology paces sector gains in May: Tech stocks performed poorly in April (-5.4%) amid higher interest rates. However, strong earnings reports from Alphabet, Apple, Microsoft, and NVIDIA helped push the sector higher in May (+10.1%). New stock buybacks from Alphabet and Apple, and the announcement of a stock split from NVIDIA also provided momentum.
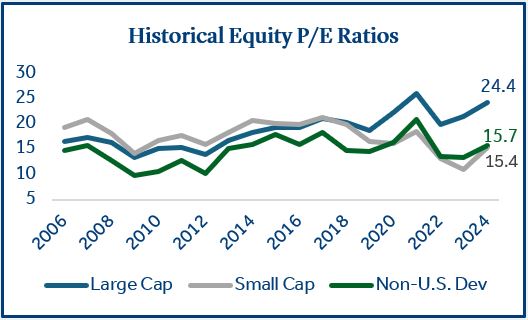
- Domestic large cap stock valuations remain elevated: U.S. large cap stocks have led equity markets higher over the past five years and multiple (Price/Earnings or P/E ratio) expansion has been the primary driver of the gains. The P/E gap between domestic equities and non-U.S. developed market equities is currently the widest it’s been in nearly twenty years2.
Trading Settlement
Effective May 28, trade settlement for most U.S. securities changed to T+1 (trade date + 1 day).
The Securities and Exchange Commission (SEC) recently adopted new rules to shorten settlement times from two days (T+2) to one day (T+1). The settlement date follows the trade date and is the day when the security officially changes hands. The change should be seamless to most investors but there are some key takeaways.
- Securities that are affected by the new T+1 changes: Stocks, bonds, exchange-traded funds (ETFs), municipal securities, mutual funds, and limited partnerships that trade on exchanges. These securities now align with options contracts and U.S. Treasuries which were already on a T+1 settlement schedule.
- U.S. investors realize numerous benefits: Shorter settlement times should provide quicker access to the cash in a transaction, lower the odds a buyer or seller will default on a transaction, reduce margin requirements, and lower the probability a financial institution would need to impose trading restrictions3.
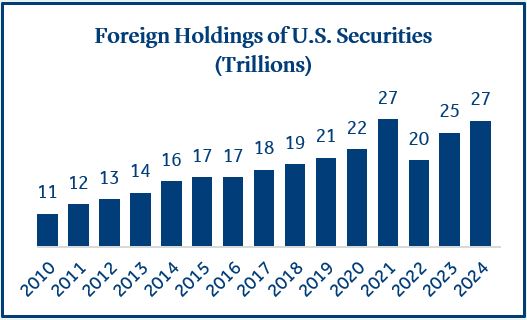
- Foreign investors contend with settlement mismatch: Global currency trades generally settle in two days and will be out of step with T+1. Non-U.S. investors transacting in U.S. securities will now need to source dollars faster. This could lead to a liquidity adjustment in currency markets shorter-term as foreign investment in the U.S. has grown to $27 trillion amid U.S. stock market outperformance4.
Global Interest Rates
Foreign central banks set to make policy changes as Fed remains idle.
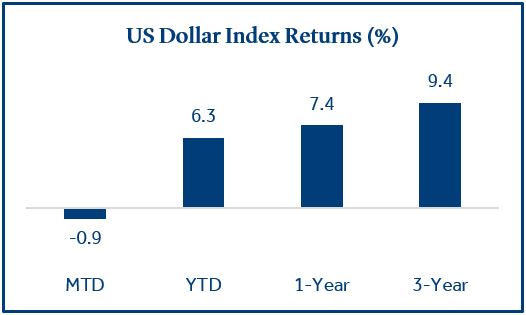
Inflation has generally declined at a quicker pace outside of the U.S. which may provide the necessary cover for foreign central banks to lower interest rates. The higher prospect for rate cuts around the globe has contributed to an appreciating dollar versus a basket of foreign currencies.
- The European Central Bank (ECB) is widely expected to lower rates in June: Inflation in the eurozone held steady at 2.4% in April and was below 3% for seven consecutive months5. Interest rate futures are currently forecasting two to three 0.25% cuts by the ECB in 2024.
- The Bank of Canada (BOC) and the Bank of England (BOE) are expected to cut rates: Inflation in Canada and the UK is below 3% and could pave the way for lower rates. The futures market is forecasting two 0.25% cuts by the BOC in 2024 and one 0.25% cut for the BOE6.
- The Bank of Japan (BOJ) raised rates to combat strong dollar: There was a landmark shift away from Japan’s negative interest rate policy in March as the BOJ raised rates for the first time in 17 years and is expected to raise rates two more times by December. However, with continued low interest rates in Japan and a strong U.S. economy, the yen continued to depreciate versus the dollar.
Federal Reserve
Commentary from the Fed suggested rates could remain higher for longer due to stubborn inflation.
Fed meeting minutes in May stated the committee was unsure about the timing of future rate cuts due to the lack of progress toward its 2% inflation target.
- Inflation (CPI) moderated in April: Investors breathed a sigh of relief as CPI was lower than expected for the first time in 2024. Prices rose 0.3% from March (0.4% estimate) and annual CPI increased 3.4% (as expected).
- The Fed will slow the pace of balance sheet runoff in June: The Fed will reduce the limit of maturing Treasuries that can roll-off its balance sheet (without replacement) from $60 to $25 billion. This statement pushed Treasury yields lower in May as it was considered by investors to signal a more “market friendly” monetary policy going forward.
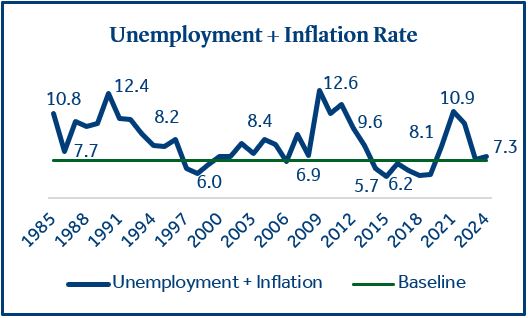
- The current economic backdrop may give the Fed flexibility: The economy continues to show strength as the April unemployment rate remained near historic lows (3.9%). Although inflation is above target (3.4%) it has settled in a tight range of 3.1% - 3.5% over the past six months. The “Misery Index” (unemployment + inflation), which is a measure of economic distress, currently sits at 7.3%. This is slightly above the baseline of 7.0%, which represents full employment (5%) plus target inflation (2%). This level should allow the Fed to be patient with future interest rate decisions.
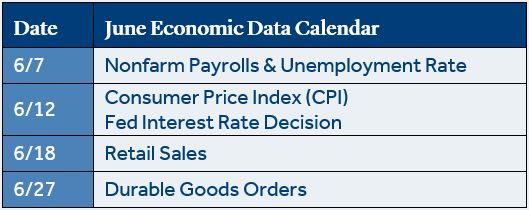
Economic Calendar
Investors will look for confirmation that the economy is healthy, and the soft-landing narrative is intact.
- April job growth was below expectations: New jobs totaled 175k for the month, well below the 240k estimate, and further below the 315k jobs added in March. Average hourly earnings rose 3.9% annually (below the 4% forecast) and have trended lower each month this year, which could be a promising sign for inflation. The unemployment rate ticked up to 3.9% versus expectations it would remain at 3.8%.
- Retail Sales were flat in April: Retail sales, a gauge of consumer strength, were flat in April, and below estimates of a 0.4% increase. In addition, March retail sales were revised down from +0.7% to +0.6%. In May, Q1 GDP (+1.6%) was revised lower (+1.3%) due to a downward revision to consumer spending7. The Consumer has been resilient in the face of higher prices, but some economists have recently suggested lower and middle-class consumers may begin to reign in discretionary spending.
- The Fed is widely expected to leave short-term rates unchanged in June: The futures market is forecasting a 99% probability the Fed will not raise rates at their June policy meeting8. It is unusual that CPI will be reported the same day as the Fed interest rate decision. However, the Fed has reiterated its patient approach and its desire to see more decisive evidence on inflation before taking action.
Click here to download the full report.
Data and rates used were indicative of market conditions as of the date shown. Opinions, estimates, forecasts, and statements of financial market trends are based on current market conditions and are subject to change without notice. This material is intended for general public use and is for educational purposes only. By providing this content, Park Avenue Securities LLC is not undertaking to provide any recommendations or investment advice regarding any specific account type, service, investment strategy or product to any specific individual or situation, or to otherwise act in any fiduciary or other capacity. Please contact a financial professional for guidance and information that is specific to your individual situation. Indices are unmanaged and one cannot invest directly in an index. Links to external sites are provided for your convenience in locating related information and services. Guardian, its subsidiaries, agents, and employees expressly disclaim any responsibility for and do not maintain, control, recommend, or endorse third-party sites, organizations, products, or services and make no representation as to the completeness, suitability, or quality thereof. Past performance is not a guarantee of future results.
Asset class returns sourced from Morningstar Direct. Asset categories listed correspond to the following underlying indices: Large Cap (S&P 500), U.S. Large Cap (S&P 500) Small Cap (Russell 2000), Non-US Dev (MSCI EAFE), Emerging Markets (MSCI EM), Bonds (Bloomberg US Aggregate Bond), US Dollar Index (DB Long US Dollar).
Treasury Yields sourced from the U.S. Department of the Treasury.
Inflation (CPI) sourced from the U.S. Bureau of Labor Statistics.
1 Source: FactSet
2 Source: Morningstar Direct
3 Source: Securities and Exchange Commission (SEC)
4 Source: Bloomberg
5 Source: CNBC
6 Source: Bloomberh
7 Source: Briefing.com
8 Source: CME FedWatch Tool
The Consumer Price Index (CPI) examines the weighted average of prices of a basket of consumer goods and services, such as transportation, food and medical care and is a commonly used measure of the rate of inflation.
Fund Funds Rate: Short-term target interest rate set by the Federal Open Market Committee (FOMC); the policy making committee of the Federal Reserve. It’s the interest that banks and other depository institutions lend money on an overnight basis.
Retail Sales represents the level of retail sales directly to U.S. consumers.
Durable Goods measure the cost of orders received by U.S. manufacturers of goods meant to last at least three years.
S&P 500 Index: Index is generally considered representative of the stock market as a whole. The index focuses on the large-cap segment of the U.S. equities market.
Russell 2000 Index: Index measures performance of the small-cap segment of the U.S. equity universe.
MSCI EAFE Index: Index measures the performance of the large and mid-cap segments of developed markets, excluding the U.S. & Canada.
MSCI EM Index: Index Measures the performance of the large and mid-cap segments of emerging market equities.
Bloomberg US Aggregate Bond Index: Index measures the performance of investment grade, U.S. dollar-denominated, fixed-rate taxable bond market, including Treasuries, government-related and corporate securities, MBS, ABS, and CMBS.
DB Long US Dollar Index: Index measures the performance of the U.S. Dollar Index Futures, which measures the performance of the U.S. dollar against a weighted basket of six major world currencies: the Euro, Japanese Yen, British Pound, Canadian Dollar, Swedish Krona, and Swiss Franc.
Park Avenue Securities LLC (PAS) is a wholly owned subsidiary of The Guardian Life Insurance Company of America (Guardian). 10 Hudson Yards, New York, NY 10001. PAS is a registered broker-dealer offering competitive investment products, as well as a registered investment advisor offering financial planning and investment advisory services. PAS is a member of FINRA and SIPC.
2024-175877 (Exp. 06/26)