
Monthly Market Commentary – June 2025
Monthly Market Commentary – June 2025
Market Update
Equities posted strong returns in May as global trade tensions eased.
Global stocks posted solid gains during the month as the U.S. and China agreed to a 90-day tariff reduction. After declining to its 2025 low on April 8th, the S&P 500 Index rallied +18.9% through the end of May. Against this backdrop, risk assets performed well as U.S. job growth remained steady, and inflation continued to decline.
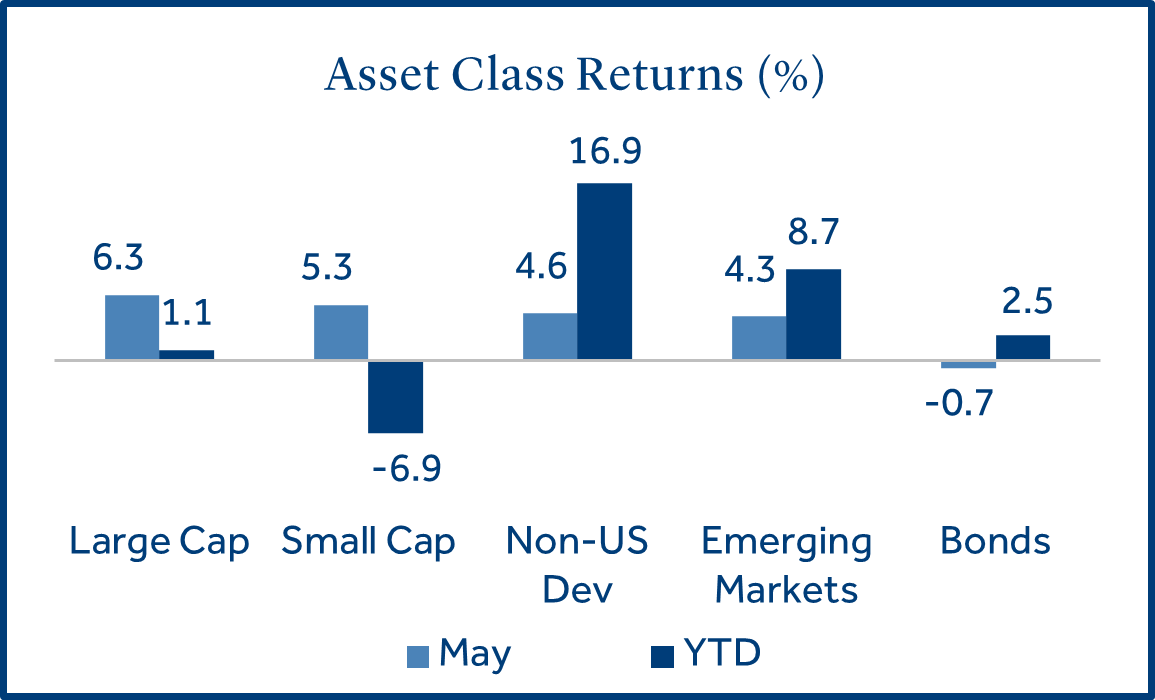
- U.S. stocks rebounded during the month as trade tension de-escalated: Large cap stocks (S&P 500 Index) rose +6.3% and outperformed small caps (Russell 2000 Index) which gained +5.3%. In addition to easing trade tensions, U.S. firms posted first quarter financial results and provided forward guidance that were largely more positive than expected.
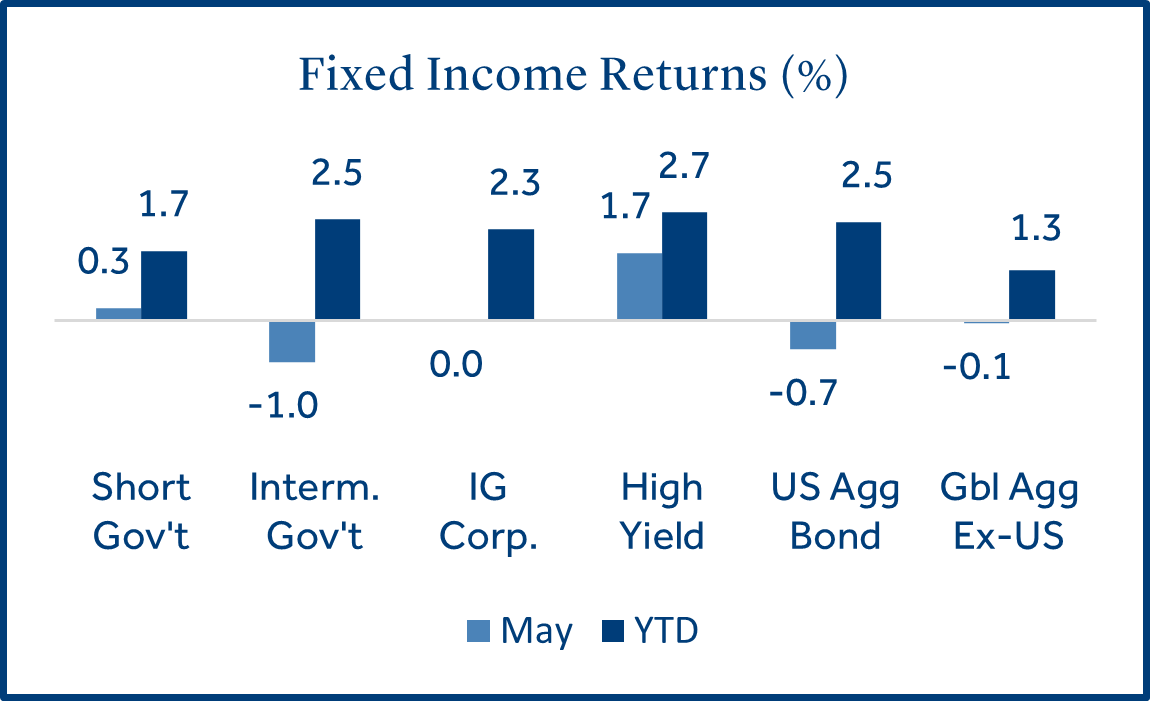
- Bonds (Bloomberg U.S. Aggregate Bond Index) declined as longer-term rates rose: The widely followed bond index lost -0.70% as the 10-year U.S. Treasury yield increased from 4.17% to 4.41% (+0.24%).
- International stocks trailed U.S. stocks for the first month since November: Developed market stocks (MSCI EAFE Index) gained +4.6% and topped Emerging Markets (MSCI EM Index) which returned +4.3%. Taiwan, a 17% weight in the EM Index, gained +12.5% on trade policy optimism and sensitivity to recent strength in the U.S. technology sector.
Equities
Technology stocks were the top performing sector for the second consecutive month.
Equity market volatility subsided in May on mostly positive trade policy developments. The S&P 500 reversed its losses from early in the year, and the index is now positive year-to-date (+1.1%).
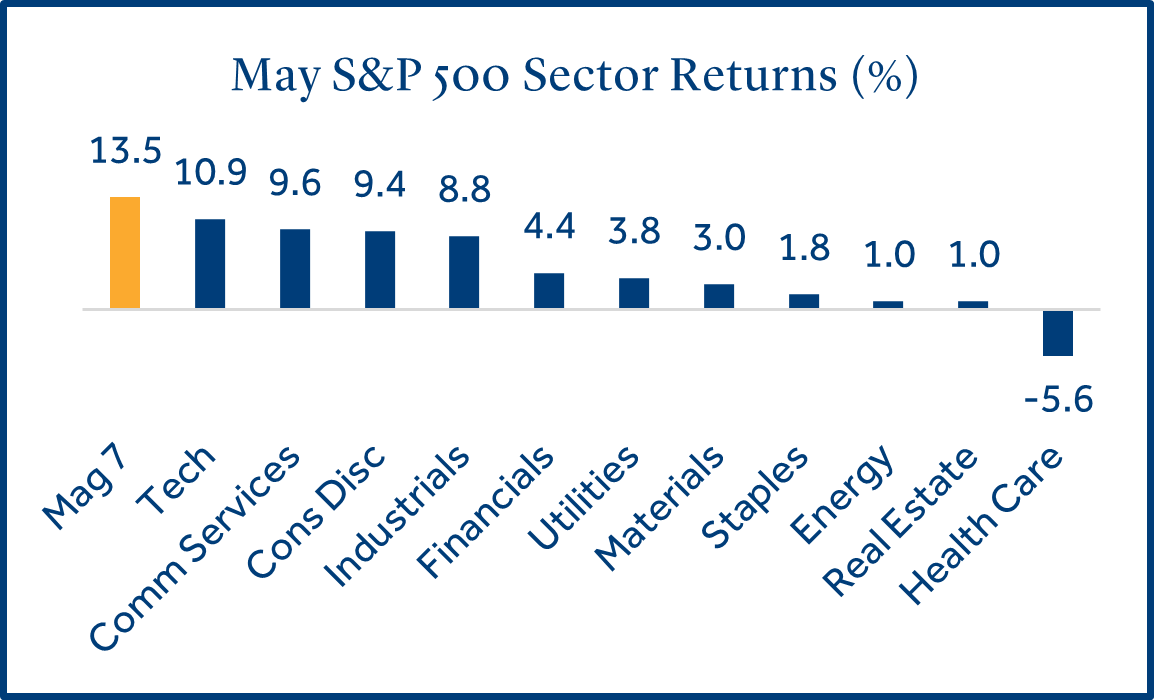
- Large cap technology stocks led the broader market higher: Tech-related mega cap stocks (Amazon, Alphabet, Apple, Meta, Microsoft, NVIDIA, and Tesla) rebounded and collectively returned +13.5% in May. After falling out of favor early in the year, the “Mag 7” stocks have now returned +29.5%, collectively, since the tariff pause on April 9th.
- Policy uncertainty weighed on health care stocks: The health care sector declined -5.6% and is one of the worst performing sectors in 2025 (-3.1%). UnitedHealth, the nation’s largest healthcare insurer, saw its stock drop -27% on a CEO departure and suspension of its 2025 financial guidance due to higher medical costs.
- Non-U.S. stocks continued to perform well: European stocks have returned +20.6% in 2025 as several countries focused on an economic revitalization due to policy uncertainty. German stocks (+31.3% YTD) led returns in the wake of a large economic stimulus plan. Even after its outperformance in 2025, the MSCI EAFE Index price-to-earnings ratio (16.2) remains at a deep discount to the S&P 500 (24.2)1.
Fixed Income
Bond returns were mixed as longer-term Treasury yields rose.
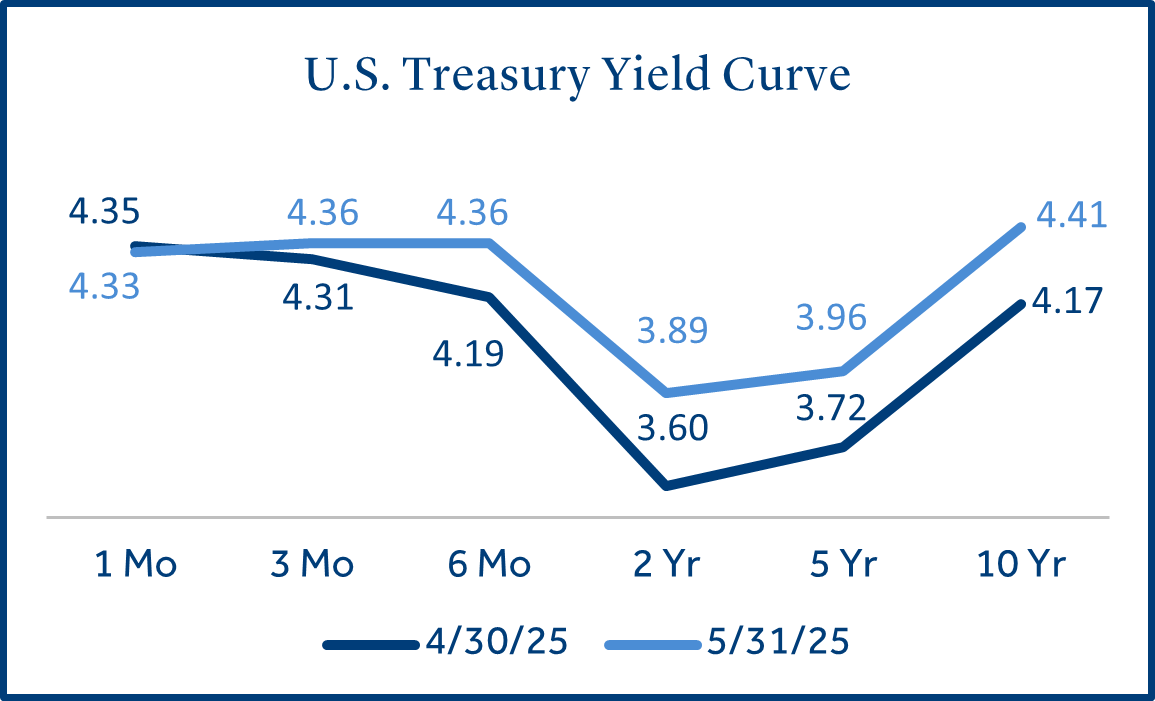
The Federal Reserve held short-term rates steady in May and remained cautious due to the risks of higher unemployment and inflation. However, the 10-year Treasury yield rose +0.24% in May, which may be due to concerns around the U.S. budget deficit or easing trade tension which could result in stronger than expected economic growth.
- Longer-term rates rose more than short-term: Demand for government bonds was soft in May as Treasury auctions had low volume. This may be due to concerns about the U.S. fiscal outlook, as investors demand higher yields to compensate for rising credit risk.
- High yield (HY) bonds outperformed as investor risk appetite increased: Investors may believe the threat of tariffs to economic growth fell as HY bonds (rated BB and below) gained +1.7%. Further, HY bonds generally have lower duration than IG bonds and were therefore less sensitive to rising yields in May.
U.S. Debt Downgrade
Moody’s downgraded U.S. Treasury bonds due to a continued rise in U.S. government debt.
Moody’s is one of the primary ratings agencies that evaluates the credit worthiness of governments and corporations. On May 16th, Moody’s lowered its U.S. credit rating from Aaa to Aa1, joining Fitch Ratings and Standard and Poor’s (S&P) to downgrade U.S. debt from the top available rating (“triple A”)2.
- Moody’s rating still represents a low default probability for the U.S.: The U.S. national debt is approaching $37 trillion and is expected to expand by nearly $2 trillion per year. Moody’s recognizes that the U.S. remains a dependable borrower but no longer believed it was worthy of the top rating.
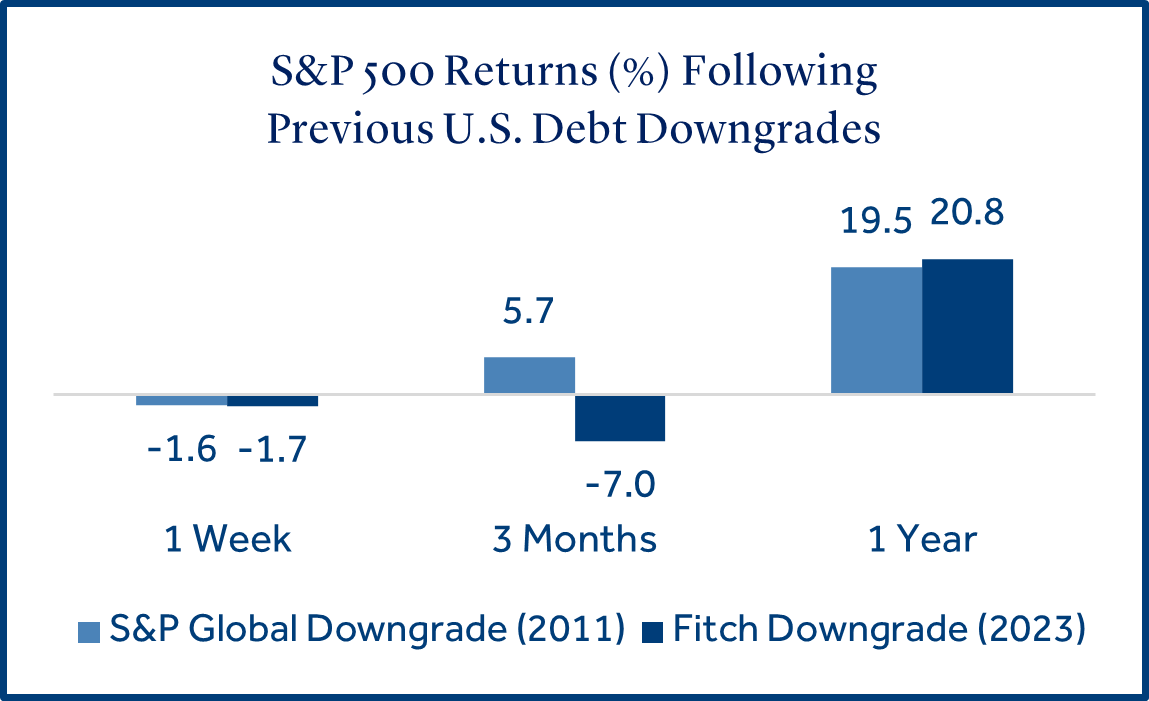
- Fitch and S&P Global Ratings have both previously downgraded U.S. credit quality: S&P took similar action to downgrade U.S. debt in 2011, and Fitch lowered their U.S. credit rating in 2023. Each firm lowered their rating one notch below their top rating and cited similar reasons for the downgrade (fiscal challenges, a growing debt burden, and repeated debt limit standoffs).
- Stocks rebounded after prior downgrades: The S&P 500 declined -2.6% the week after the recent Moody’s downgrade. In similar fashion, stocks were negative the first week after the Fitch and S&P downgrades, but these losses ended up being short-lived. A resilient labor market, easing trade tensions, and solid quarter for corporate profits could be potential catalysts that lead stocks higher longer-term.
Tariffs
Trade tensions eased in May as the U.S. and China agreed to lower tariffs for 90 days.
Tariff rhetoric has driven market volatility in recent months. However, the rollback of tariffs with China and recent advancements with the European Union led to investor optimism in May.
- The U.S. and China agreed to lower tariff levels for 90 days: The U.S. rate on Chinese imports was reduced from 145% to 30%, and Chinese levies on U.S. goods fell from 125% to 10%. The news provided hope of a potential trade deal between the #1 and #2 economies.
- Tariffs to remain in effect following court ruling: Several U.S. businesses filed petitions recently to halt tariffs. On May 28th, the U.S. Court of International Trade ruled President Trump exceeded his authority on many of the new tariffs levied on U.S. trading partners. However, the administration appealed, and a federal court temporarily reinstated tariffs the next day. The levies will remain in place while judges weigh the underlying legal justification.
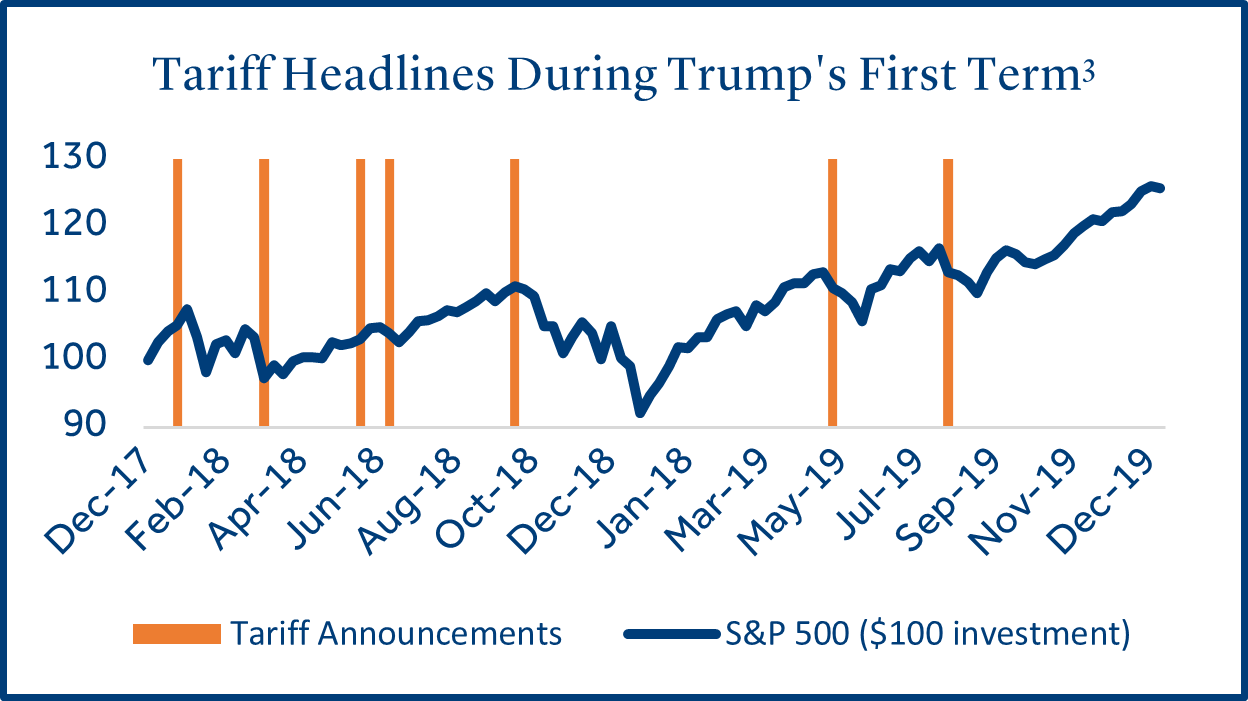
- Tariffs were a source of market volatility during the first Trump administration: 2018 was a volatile period as the S&P 500 Index declined as much as -13.5% from its high and lost -4.4% for the year. However, the index rose sharply in 2019 (+31.5%) as trade deals were made and consumer spending remained steady. It is important to note tariffs are only one input into asset prices and equity markets have been resilient over longer time periods3.
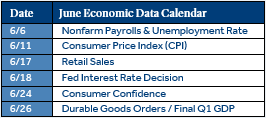
Economic Calendar
Consumer confidence jumped the most in four years on tariff pause.
U.S. consumer confidence rebounded in May from a near five-year low with the improvement being broad-based across income and age ranges4. Individuals were more upbeat about the health of the labor market and business conditions, especially following the rollback of U.S.-China tariffs in mid-May.
- New job growth exceeded expectations: +177k jobs were created in April, above the forecast (+133k), and the 12-month average (+152k). The unemployment rate was steady at 4.2%. A strong labor market could be the key to the U.S. avoiding an economic recession. A steady decline in new jobs or a rise in weekly jobless claims could be cause for concern.
- The Consumer Price Index (CPI) declined for the third consecutive month: Prices rose by +2.3% (annualized) in April, below the forecast (+2.4%) and lowest reading since February 2021. Prices declined for gasoline, groceries, and air fares. The upcoming May report will be heavily scrutinized as it is expected to capture the initial effect of new tariffs.
- The House passed the President’s new tax bill, which is now headed to the Senate: The bill would extend Trump’s first-term tax cuts, provide certain individuals with new tax relief, and incentivize small businesses to create jobs and expand operations. However, the bill is also expected to increase the U.S. debt burden, and some economists believe it has the potential to worsen economic inequality2.
Click here for a download of the full commentary.
Data and rates used were indicative of market conditions as of the date shown. Opinions, estimates, forecasts, and statements of financial market trends are based on current market conditions and are subject to change without notice. This material is intended for general public use and is for educational purposes only. By providing this content, Park Avenue Securities LLC is not undertaking to provide any recommendations or investment advice regarding any specific account type, service, investment strategy or product to any specific individual or situation, or to otherwise act in any fiduciary or other capacity. Please contact a financial professional for guidance and information that is specific to your individual situation. Indices are unmanaged and one cannot invest directly in an index. Links to external sites are provided for your convenience in locating related information and services. Guardian, its subsidiaries, agents, and employees expressly disclaim any responsibility for and do not maintain, control, recommend, or endorse third-party sites, organizations, products, or services and make no representation as to the completeness, suitability, or quality thereof. Past performance is not a guarantee of future results.
All investments involve risks, including possible loss of principal. Equities may decline in value due to both real and perceived general market, economic, and industry conditions. Fixed income securities involve interest rate, credit, inflation, and reinvestment risks, and possible loss of principal. As interest rates rise, the value of fixed income securities falls. Low-rated, high yield bonds are subject to greater price volatility. Investing in securities of smaller companies tends to be more volatile and less liquid than securities of larger companies. Investing in foreign securities may involve heightened risk including currency fluctuations, less liquid trading markets, greater price volatility, political and economic instability, less publicly available information and changes in tax or currency laws. Such risks are enhanced in emerging markets.
Asset class returns sourced from Morningstar Direct. Asset categories listed correspond to the following underlying indices: Large Cap (S&P 500), Small Cap (Russell 2000), Non-US Dev (MSCI EAFE), Emerging Markets (MSCI EM), Bonds (Bloomberg US Aggregate Bond), Short Gov’t (Bloomberg Short Treasury), Interm Gov’t (Bloomberg US Treasury), IG Corp (Bloomberg US Corp. Bond), High Yield (Bloomberg High Yield Corporate), Global Agg ex-US (Bloomberg Global Agg Ex US – Hedged).
Treasury Yields sourced from the U.S. Department of the Treasury.
Inflation (CPI) sourced from the U.S. Bureau of Labor Statistics.
Unemployment statistics sourced from the Department of Labor.
1 Source: Morningstar Direct
2 Source: Bloomberg
3 Source: Capital Group / American Funds
4 Source: The Conference Board
The Consumer Price Index (CPI) examines the weighted average of prices of a basket of consumer goods and services, such as transportation, food, and medical care, and is a commonly used measure of the rate of inflation.
Retail Sales represents the level of retail sales directly to U.S. consumers.
Durable Goods measure the cost of orders received by U.S. manufacturers of goods meant to last at least three years.
Fed Funds Rate: Short-term target interest rate set by the Federal Open Market Committee (FOMC); the policy making committee of the Federal Reserve. It is the interest that banks and other depository institutions lend money on an overnight basis.
S&P 500 Index: Index is generally considered representative of the stock market as a whole. The index focuses on the large-cap segment of the U.S. equities market.
Russell 2000 Index: Index measures performance of the small-cap segment of the U.S. equity universe.
MSCI EAFE Index: Index measures the performance of the large and mid-cap segments of developed markets, excluding the U.S. & Canada.
MSCI EM Index: Index Measures the performance of the large and mid-cap segments of emerging market equities.
Bloomberg US Aggregate Bond Index: Index measures the performance of investment grade, U.S. dollar-denominated, fixed-rate taxable bond market, including Treasuries, government-related and corporate securities, MBS, ABS, and CMBS.
Park Avenue Securities LLC (PAS) is a wholly owned subsidiary of The Guardian Life Insurance Company of America (Guardian). 10 Hudson Yards, New York, NY 10001. PAS is a registered broker-dealer offering competitive investment products, as well as a registered investment advisor offering financial planning and investment advisory services. PAS is a member of FINRA and SIPC.
7069921.12 (Exp. 5/27)