
Monthly Market Commentary – March 2026
Monthly Market Commentary – March 2026
Market Update
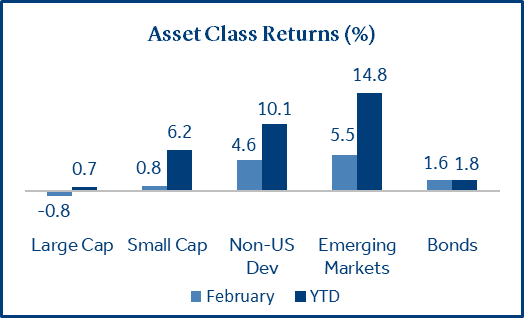
Emerging market stocks outperformed year-to-date as international equities continued to lead returns.
Asset class performance in February continued to reflect the rotation in market leadership that began in 2025. Volatility was elevated as investors shifted from large cap technology stocks into small cap and international stocks. Economic data was mixed as job growth rebounded but retail sales disappointed.
- Small caps gained on declining borrowing costs and attractive valuations: Small caps (Russell 2000) added +0.8% and outperformed large caps (S&P 500) which lost -0.8%. Easing borrowing costs, a valuation discount to large caps, and strong earnings momentum drove outperformance.
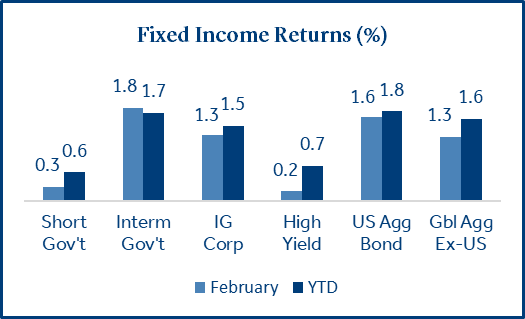
- Treasury yields fell on geopolitical tension and softer economic data: The Bloomberg US Agg Bond Index gained +1.6% as the 10-year Treasury yield fell by -0.29% to 3.97%. Treasuries returned +1.8%, while Mortgage-backed securities (MBS) gained +1.7% and investment grade corporates added +1.3%.
- International stocks outperformed as Japan posted strong gains: Developed markets got a boost from Japan (+8.6%) as Prime Minister Takaichi’s victory provides political clarity and expectations for improved growth. South Korea (+22.0%) led EM returns and continued to benefit from the AI infrastructure buildout.
Equities
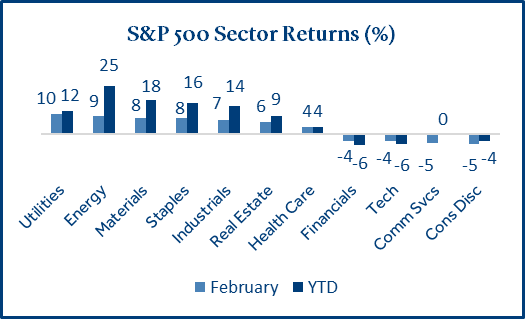
U.S. equity performance was driven by a rotation into more cyclical and “real economy” sectors.
Investors rotated away from mega‑cap technology stocks toward asset‑intensive sectors like energy, utilities, and industrials. These industries benefit from tangible, capital‑heavy businesses that generate real‑world goods and services, areas that are seen as less vulnerable to disruption from generative AI.
- Energy stocks surged +25% to start the year, boosted by strong capital discipline: Energy companies have emphasized dividends, and share repurchases, underpinned by robust free cash flows. Additionally, oil prices marched higher amid rising tension between the U.S. and Iran, adding an additional tailwind to the sector.
- The “Magnificent Seven” stocks lagged in February (-7.3%) on rising capex concerns: Investors have become nervous of the massive AI-related capital expenditures impacting firms like Amazon (Cons Disc), Alphabet, and Meta (Comm Services) who signaled sharply higher spending which could reduce profitability.
- Corporate financial results have been solid with 96% of S&P 500 firms reporting: At this late stage of the Q4 earnings season, 73% of companies reported revenues above estimates, which are above the 5-year (70%) and 10-year (66%) averages. Earnings growth was +14.2% and if that holds, it will mark the fifth consecutive quarter of double-digit growth for the index1.
Fixed Income
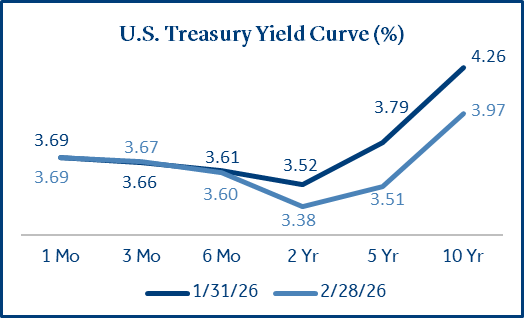
Bonds rallied as longer-term interest rates declined the most since February 2025.
Demand for fixed income securities improved in February as AI-related volatility stressed parts of the equity market, inflation eased, and spending slowed, which all contributed to lower rates.
- Longer-term yields declined on softening inflation and retail sales: Inflation (CPI) rose 2.4% annualized in January, down -0.3% from the prior month and the lowest since May 2025. Retail sales disappointed (0.0%) and were flat for the December holiday shopping season. Lower inflation and retail sales could boost the outlook for Fed rate cuts in 2026.
- Private credit returns to the spotlight: While the Tricolor default is now in the past, recent loan sales by Blue Owl funds returned attention to private credit markets. Although the activity drew increased scrutiny, transactions clearing near par suggested that underlying valuations remain relatively stable, as investors continue to monitor the space closely.
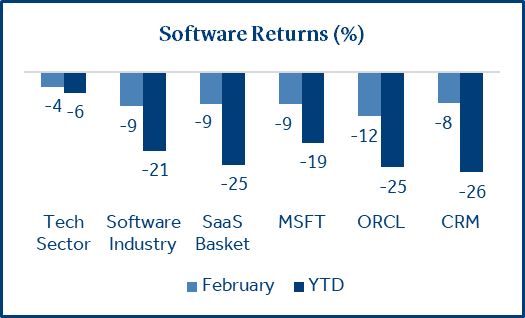
Software Industry
Software stocks were under pressure as investors reassessed AI monetization and current valuations.
The software industry has experienced heightened volatility, particularly among “Software as a Service” (SaaS) companies. These firms, such as Salesforce and Oracle, deliver applications via the cloud on a subscription basis, providing ongoing updates, enhancements, and maintenance for subscribers. Application software firms within the S&P 500 index have declined -25% in 2026.
- The selloff reflects a change in sentiment rather than a collapse in fundamentals: The decline has been fueled by anxiety around rapidly advancing AI technology. Some have speculated that AI could act as a replacement for these applications or dramatically reduce the number of subscriptions that companies require. Importantly, the earnings expectations have remained largely intact for these firms, which may indicate the repricing has been driven by uncertainty, and not a deterioration in business fundamentals.
- Competition is increasing, but the leading firms are still well positioned to defend their businesses: AI is likely to lower barriers to entry and result in faster innovation, leading to adjustments to the business strategies for top firms. However, deep expertise, proprietary datasets, and high switching costs are likely to slow displacement.
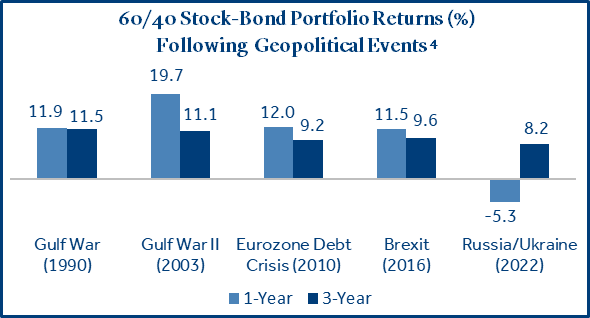
Geopolitical Events
The U.S. conducted military strikes in Iran and the Supreme Court ruled to block broad-based tariffs.
On February 28th, the U.S. and Israel carried out coordinated air strikes aimed at deterring Iran’s nuclear ambitions. Separately, the Supreme Court struck down a central pillar of the administration’s trade agenda, ruling that broad IEEPA-based tariffs were unconstitutional.
- Oil prices jumped on the heightened risk of supply disruptions: Oil rose 6% on March 1st as Iran accounts for 4% and the Middle East accounts for one-third of the global oil supply. Additionally, the Strait of Hormuz supports about 20% of the world’s oil consumption and Iran’s proximity to the area poses the risk of supply and transport disruptions2.
- Investors should prepare for uncertainty but maintain investment discipline: A risk for investors is that a prolonged conflict may drive energy prices higher, which could boost inflation, and reduce the probability of near-term Fed rate cuts. While geopolitical events often lead to volatility in the initial stages, these effects tend to moderate over time.
- The administration moved quickly with a “Plan B” for tariffs: In response to the ruling, the President imposed a new 10% global tariff under a provision allowing for temporary tariffs of up to 15% for 150 days. The average tariff rate is expected to fall from 16% to 14%, with congressional approval required for the new tariffs to extend beyond the 150-day window3.
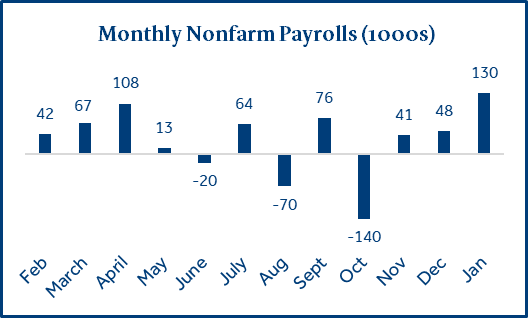
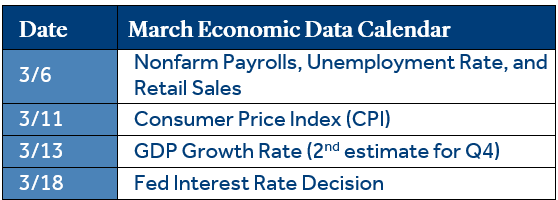
Economic Calendar
Monthly job growth topped expectations while GDP growth slowed due to the government shutdown.
Recent economic data has provided mixed signals. Monthly job growth was strong but revisions to 2025 were weak, GDP growth stalled but it was likely due to the government shutdown, and CPI inflation (+2.4%) was soft while PCE inflation (+2.9%) ran hot.
- Monthly job growth topped expectations but total job growth for 2025 was revised lower: January job growth (+130k) topped the forecast (+70k) and was the largest monthly gain since December 2024. However, significant revisions to the 2025 data pushed last year’s employment down by -403k jobs, resulting in just +181k new jobs added in 2025. The unemployment rate for January ticked down -0.1% to 4.3%.
- Economic growth (GDP) was hampered by the government shutdown: Fourth quarter GDP rose at an annual rate of just +1.4%, which was well below the forecast (+2.5%) and third quarter growth of +4.4%. Personal consumption and corporate spending rose as expected but the 43-day shutdown reduced federal spending by -17% and is estimated to have reduced GDP growth by -1.2% for the quarter5.
To download the printable version, CLICK HERE.
Data and rates used were indicative of market conditions as of the date shown. Opinions, estimates, forecasts, and statements of financial market trends are based on current market conditions and are subject to change without notice. This material is intended for general public use and is for educational purposes only. By providing this content, Park Avenue Securities LLC is not undertaking to provide any recommendations or investment advice regarding any specific account type, service, investment strategy or product to any specific individual or situation, or to otherwise act in any fiduciary or other capacity. Please contact a financial professional for guidance and information that is specific to your individual situation. Indices are unmanaged and one cannot invest directly in an index. Links to external sites are provided for your convenience in locating related information and services. Guardian, its subsidiaries, agents, and employees expressly disclaim any responsibility for and do not maintain, control, recommend, or endorse third-party sites, organizations, products, or services and make no representation as to the completeness, suitability, or quality thereof. Past performance is not a guarantee of future results.
All investments involve risks, including possible loss of principal. Equities may decline in value due to both real and perceived general market, economic, and industry conditions. Fixed income securities involve interest rate, credit, inflation, and reinvestment risks, and possible loss of principal. As interest rates rise, the value of fixed income securities falls. Low-rated, high yield bonds are subject to greater price volatility. Investing in securities of smaller companies tends to be more volatile and less liquid than securities of larger companies. Investing in foreign securities may involve heightened risk including currency fluctuations, less liquid trading markets, greater price volatility, political and economic instability, less publicly available information and changes in tax or currency laws. Such risks are enhanced in emerging markets.
Asset class returns sourced from Morningstar Direct. Asset categories listed correspond to the following underlying indices: Large Cap (S&P 500), Small Cap (Russell 2000), Non-US Dev (MSCI EAFE), Emerging Markets (MSCI EM), Bonds (Bloomberg US Aggregate Bond), Short Gov’t (Bloomberg Short Treasury), Interm Gov’t (Bloomberg US Treasury), IG Corp (Bloomberg US Corp. Bond), High Yield (Bloomberg High Yield Corporate), Global Agg ex-US (Bloomberg Global Agg Ex US – Hedged), Tech Sector (S&P 500 Information Technology), Software Industry (S&P 500 Ind/Software), Saas Basket (S&P 500 Sub/Application Software), MSFT (Microsoft Corp), ORCL (Oracle Corp), CRM (Salesforce Inc).
Treasury Yields sourced from the U.S. Department of the Treasury.
Nonfarm payrolls, unemployment statistics, and inflation (CPI) are sourced from the Department of Labor.
1 Source: FactSet
2 Source: U.S. Energy Information Administration
3 Source: The Budget Lab at Yale
4 Source: Morningstar Direct. Portfolio returns reflect allocations of 60% in the S&P 500 Index and 40% in the Bloomberg Aggregate Bond Index. 3-year returns are annualized. Past performance is not a reliable indicator of future results.
5 Source: Reuters
IEEPA refers to the International Emergency Economic Powers Act (IEEPA), a 1977 law that allows the executive to “regulate commerce” during national emergencies created by foreign threats.
The Consumer Price Index (CPI) examines the weighted average of prices of a basket of consumer goods and services, such as transportation, food, and medical care, and is a commonly used measure of the rate of inflation.
Retail Sales represents the level of retail sales directly to U.S. consumers.
Fed Funds Rate: Short-term target interest rate set by the Federal Open Market Committee (FOMC); the policy making committee of the Federal Reserve. It is the interest that banks and other depository institutions lend money on an overnight basis.
S&P 500 Index: Index is generally considered representative of the stock market as a whole. The index focuses on the large-cap segment of the U.S. equities market.
Russell 2000 Index: Index measures performance of the small-cap segment of the U.S. equity universe.
MSCI EAFE Index: Index measures the performance of the large and mid-cap segments of developed markets, excluding the U.S. & Canada.
MSCI EM Index: Index Measures the performance of the large and mid-cap segments of emerging market equities.
Bloomberg US Aggregate Bond Index: Index measures the performance of investment grade, U.S. dollar-denominated, fixed-rate taxable bond market, including Treasuries, government-related and corporate securities, MBS, ABS, and CMBS.
Park Avenue Securities LLC (PAS) is a wholly owned subsidiary of The Guardian Life Insurance Company of America (Guardian). 10 Hudson Yards, New York, NY 10001. PAS is a registered broker-dealer offering competitive investment products, as well as a registered investment advisor offering financial planning and investment advisory services. PAS is a member of FINRA and SIPC.
PAS018129
7069921.22 (Exp. 2/28)