
Monthly Market Commentary – November 2025
Monthly Market Commentary – November 2025
Market Update
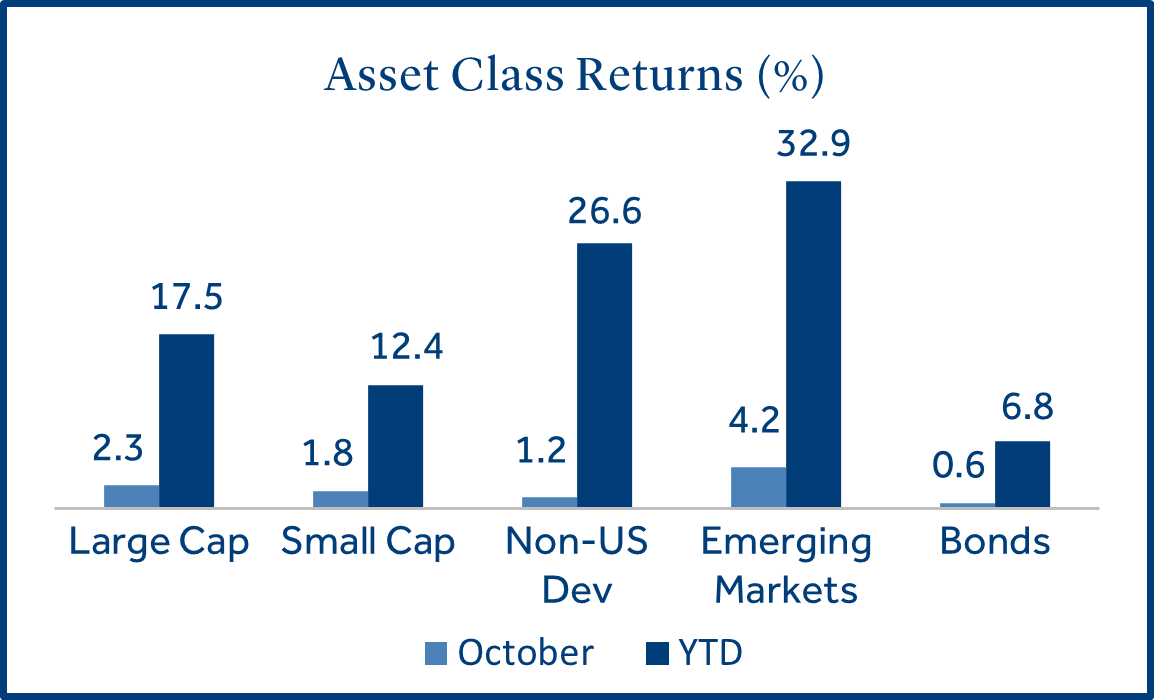
Capital markets posted solid gains in October, led by large caps and emerging markets.
The S&P 500 notched its sixth consecutive month of gains and reached a new all-time high in October. A positive start to corporate earnings season, tame CPI inflation in September and a Federal Reserve (Fed) rate cut set the stage for a rally in risk assets.
- Large caps outpaced small caps on strong earnings: Large cap stocks (S&P 500) gained +2.3% while small cap stocks (Russell 2000) returned +1.8%. Large cap tech stocks tied to artificial intelligence (AI) and cloud computing benefited from stable cash flows and strong balance sheets during economic uncertainty.
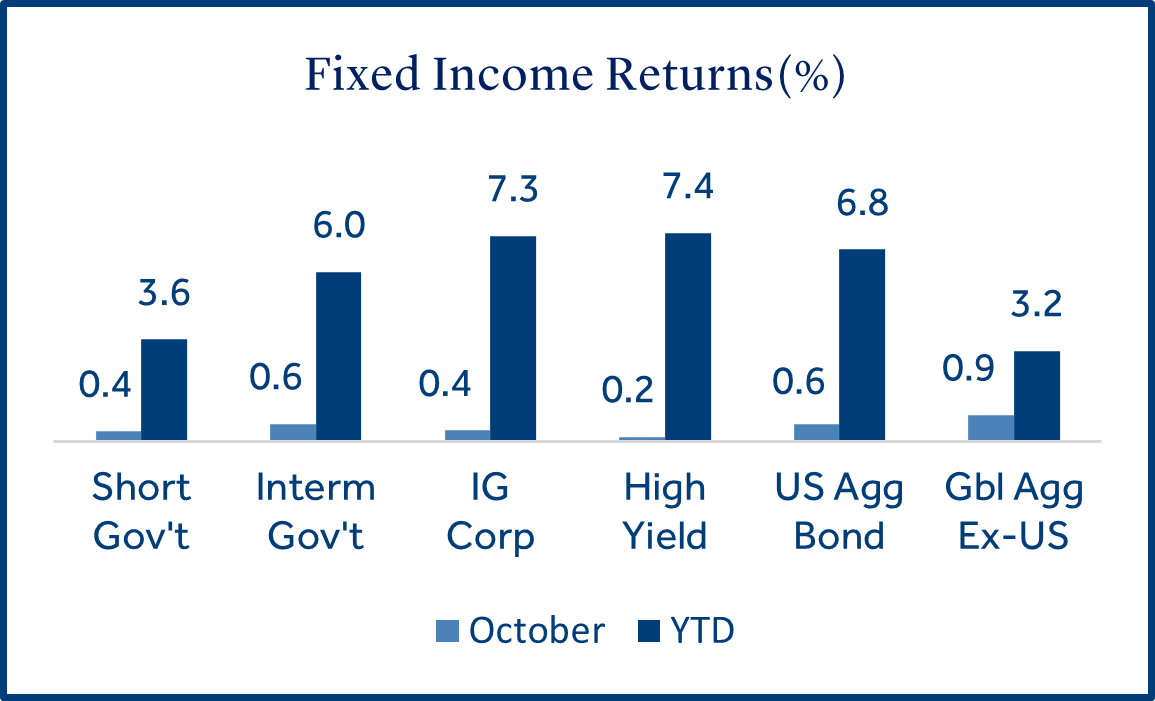
- Bond markets rallied as yields fell for the third consecutive month: The Bloomberg US Aggregate Bond Index gained +0.6% as the 10-year Treasury yield declined from 4.16% to 4.11%. Mortgage-backed securities led sector returns (+0.9%) but Treasuries (+0.6%) and Corporates (+0.4%) also posted positive gains.
- Emerging markets are on pace for their best year since 2017: The MSCI EM Index rose +4.2% in October, following a +7.2% rise in September. Developed markets (MSCI EAFE) posted a +1.2% gain. South Korean stocks (+22.6%) led EM returns due to new capital market reforms and exposure to the AI theme.
Equities
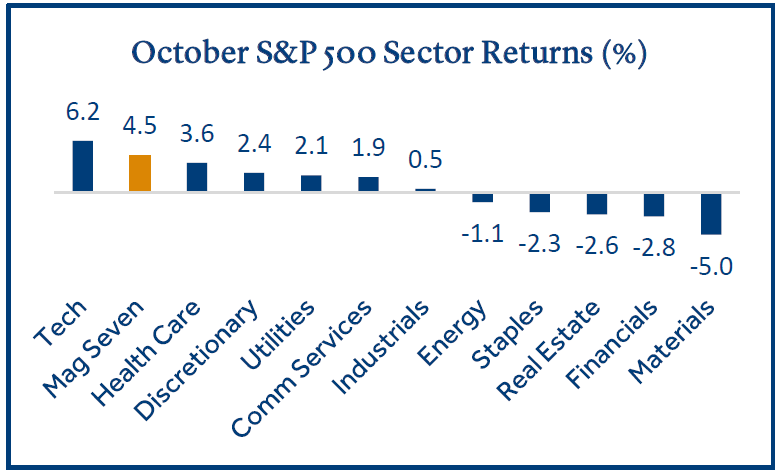
AI-driven sectors led equities higher as the impact of artificial intelligence has spread beyond tech stocks.
Large caps and small caps gained +38% and +42%, respectively from the April 2025 bottom. Large cap technology stocks have gained a staggering +71% since then as the AI boom and explosive growth in data centers propelled these stocks higher. However, other sectors have started to reap the benefits of AI.
- Large cap tech stocks have powered equity markets higher: Tech stocks were the clear leader in October as investors may be viewing AI-related demand as insulated from economic uncertainty and the government shutdown. The surging demand for electricity to power AI data centers also boosted utility stocks.
- The health care sector has rebounded from rising demand and AI integration: Health care stocks gained +11.1% during the three-month period ending October 31st, trailing only tech and comm services. A post-pandemic recovery in elective health services and robust growth in robotic and AI-driven medicine boosted returns.
- Corporate earnings results are off to their best start since 2021: 64% of S&P 500 firms have reported Q3 financial results. 83% beat earnings-per-share estimates while 79% topped revenue forecasts. Both metrics are well above their 5- and 10-year average1.
Fixed Income
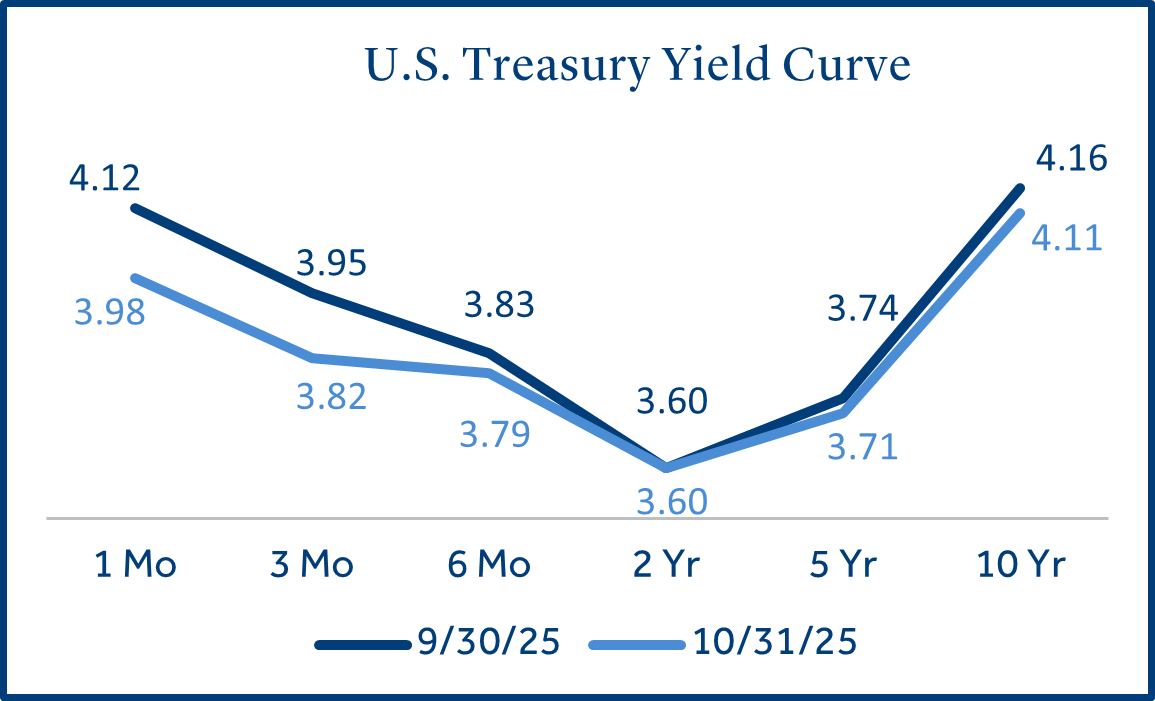
Bond markets climbed as Treasury yields eased.
The Fed cut interest rates by -0.25% for the second consecutive month. Treasury yields are near their 2025 lows as the 10-year yield dipped below 4% in October for the first time in over a year.
- Yields declined across the Treasury curve: Shorter-term rates moved lower on the heels of recent Fed rate cuts while longer-term yields dipped modestly due to weakening economic data and softer than forecasted inflation.
- Corporate bonds have led fixed income markets higher in 2025: Investment grade (IG) and high yield corporates currently offer 4.8% and 6.7% average yields, respectively2. However, credit spreads (or the yield premium for corporate bonds over treasuries) are near multi-decade lows signaling the risk appetite from bond investors has remained elevated3.
Credit Markets
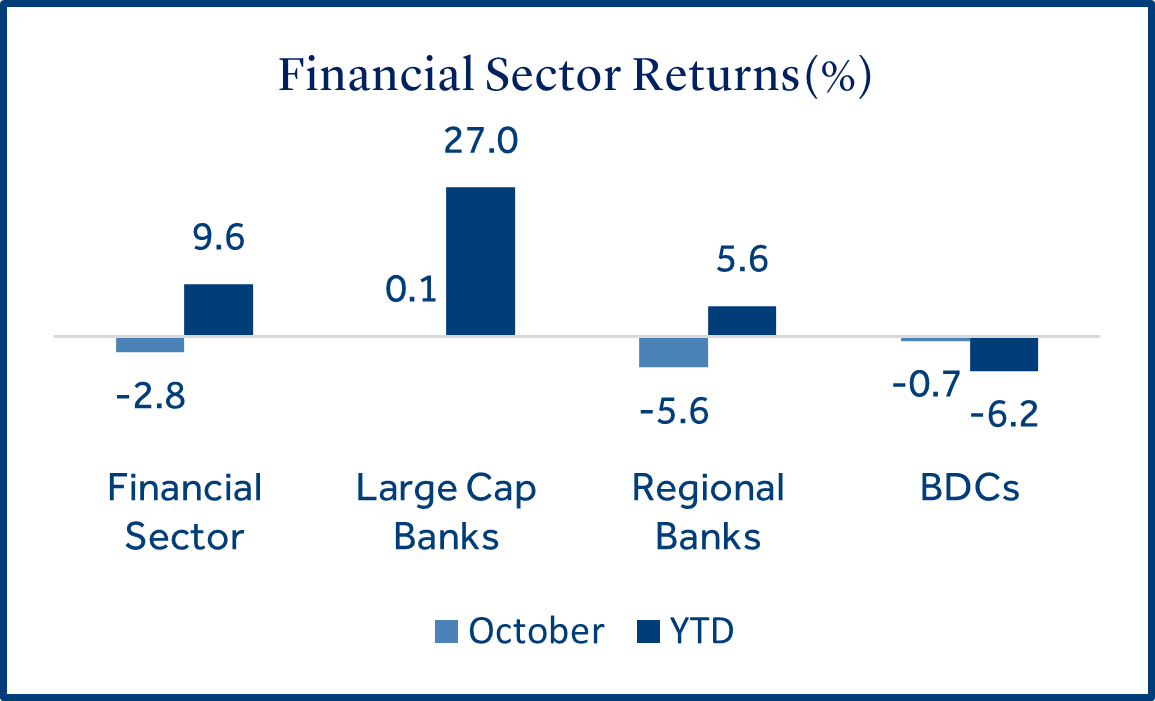
Credit markets and regional banks were rattled by fraud allegations in October.
The U.S. credit markets faced turbulence during the month that was driven by a series of high profile bankruptcies and fraud allegations. This resulted in price declines for some regional banks and business development companies (BDCs), which are specialty finance companies that invest in the debt of small and mid-size businesses.
- Bankruptcy filings and fraud spark concerns in credit markets: First Brands Group (auto parts supplier), and Tricolor Holdings (subprime auto lender) both collapsed under billions in debt. First Brands’ failure was tied to aggressive borrowing while Tricolor’s was linked to fraud allegations. Additionally, commercial real estate firm Cantor Group defaulted on a series of loans and allegedly misrepresented the collateral used to secure $160 million in financing.
- Regional banks and BDCs took the largest losses: U.S. regional banks found themselves in the grip of credit fears in mid-October. The regional bank index declined -10% during the first half of the month but later recovered about half of its losses as many analysts believe these events were isolated and not representative of a systemic issue in credit markets.
U.S. Government
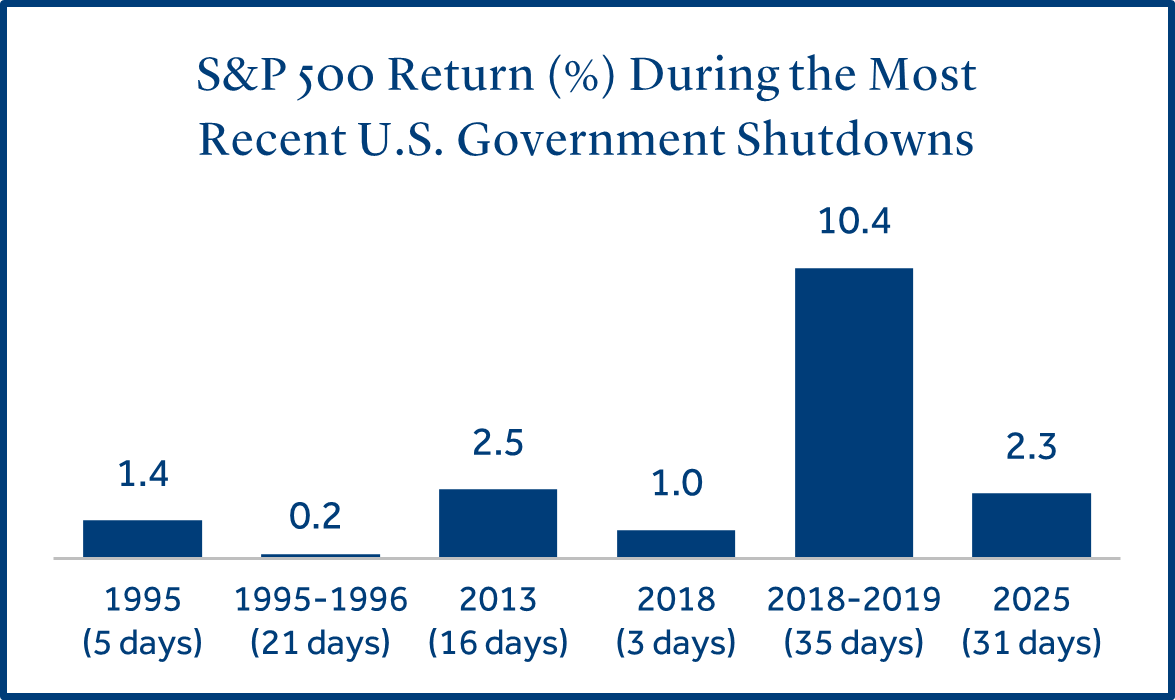
The U.S. is now in the second-longest government shutdown period in its history.
The Congressional Budget Office projected the four-week shutdown will reduce fourth-quarter GDP by -1.0%. A portion of the lost growth may return in the first quarter of 2026, but the shutdown could permanently reduce the U.S. economy by $7-$14 billon, depending on its length4.
- October ended with the shutdown period at 31 days: The Senate voted and failed 13 times to pass a funding bill that would reopen the government. Bipartisan talks to end the shutdown have increased recently but have not progressed to any formal negotiations.
- The U.S. and China continued to negotiate a preliminary framework for a trade deal: Key aspects of the agreement call for China to relax export controls on rare earth minerals, a pledge to resume purchasing U.S. agricultural products and cooperation on curbing fentanyl exports into the U.S. In return, China would likely see a significant reduction in U.S. tariffs.
- Despite the prolonged shutdown, capital markets have been resilient: Investors have shrugged off the disruption and focused on strong corporate earnings and recent Fed rate cuts. Investors who stay invested and avoid reactive trading during political uncertainty have historically been rewarded.
Economic Calendar
The government shutdown has led to delays in key economic data reporting.
The shutdown has led to a widespread data blackout as agencies like the Bureau of Labor Statistics halted operations. Economic data such as job growth, retail sales, and GDP were not released in October.
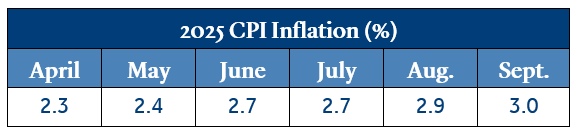
- Inflation has been steadily rising since April: Inflation rose from +2.9% to +3.0%, annualized, but was below the forecast of +3.1%. Capital markets cheered the report, but inflation has steadily increased since bottoming in April at +2.3%. CPI was delayed but later released after the Department of Labor recalled staff to meet the Social Security cost of living adjustment deadline. However, October CPI is unlikely to be reported, even if the shutdown ends, due to missed surveys and data collection gaps that are time sensitive5.
- The Fed cut short-term rates by -0.25% for the second consecutive month: The decision was driven by signs of a softening labor market. Fed Chair Powell indicated a December rate cut is not a foregone conclusion, citing divided views within the committee and the challenges of navigating central bank policy without full economic visibility. Interest rate futures reflect a 70% probability of a -0.25% cut in December6.
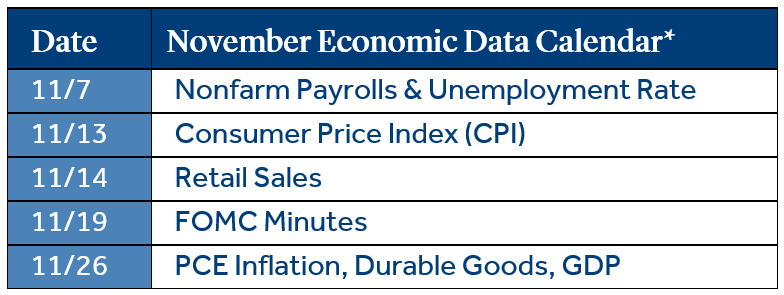
*Represents the schedule of data releases. Reports may not be released timely even if the government shutdown period ends.
To download the printable version, CLICK HERE.
Data and rates used were indicative of market conditions as of the date shown. Opinions, estimates, forecasts, and statements of financial market trends are based on current market conditions and are subject to change without notice. This material is intended for general public use and is for educational purposes only. By providing this content, Park Avenue Securities LLC is not undertaking to provide any recommendations or investment advice regarding any specific account type, service, investment strategy or product to any specific individual or situation, or to otherwise act in any fiduciary or other capacity. Please contact a financial professional for guidance and information that is specific to your individual situation. Indices are unmanaged and one cannot invest directly in an index. Links to external sites are provided for your convenience in locating related information and services. Guardian, its subsidiaries, agents, and employees expressly disclaim any responsibility for and do not maintain, control, recommend, or endorse third-party sites, organizations, products, or services and make no representation as to the completeness, suitability, or quality thereof. Past performance is not a guarantee of future results.
All investments involve risks, including possible loss of principal. Equities may decline in value due to both real and perceived general market, economic, and industry conditions. Fixed income securities involve interest rate, credit, inflation, and reinvestment risks, and possible loss of principal. As interest rates rise, the value of fixed income securities falls. Low-rated, high yield bonds are subject to greater price volatility. Investing in securities of smaller companies tends to be more volatile and less liquid than securities of larger companies. Investing in foreign securities may involve heightened risk including currency fluctuations, less liquid trading markets, greater price volatility, political and economic instability, less publicly available information and changes in tax or currency laws. Such risks are enhanced in emerging markets.
Asset class returns sourced from Morningstar Direct. Asset categories listed correspond to the following underlying indices: Large Cap (S&P 500), Small Cap (Russell 2000), Non-US Dev (MSCI EAFE), Emerging Markets (MSCI EM), Bonds (Bloomberg US Aggregate Bond), Short Gov’t (Bloomberg Short Treasury), Interm Gov’t (Bloomberg US Treasury), IG Corp (Bloomberg US Corp. Bond), High Yield (Bloomberg High Yield Corporate), Global Agg ex-US (Bloomberg Global Agg Ex US – Hedged).
Treasury Yields sourced from the U.S. Department of the Treasury.
Inflation (CPI) sourced from the U.S. Bureau of Labor Statistics.
Unemployment statistics sourced from the Department of Labor.
1 Source: FactSet
2 Source: Federal Reserve Bank of St. Louis
3 Source: Federated Hermes
4 Source: Fortune
5 Source: Reuters
6 Source: CME FedWatch Tool
The Consumer Price Index (CPI) examines the weighted average of prices of a basket of consumer goods and services, such as transportation, food, and medical care, and is a commonly used measure of the rate of inflation.
Retail Sales represents the level of retail sales directly to U.S. consumers.
Durable Goods measure the cost of orders received by U.S. manufacturers of goods meant to last at least three years.
Fed Funds Rate: Short-term target interest rate set by the Federal Open Market Committee (FOMC); the policy making committee of the Federal Reserve. It is the interest that banks and other depository institutions lend money on an overnight basis.
S&P 500 Index: Index is generally considered representative of the stock market as a whole. The index focuses on the large-cap segment of the U.S. equities market.
Russell 2000 Index: Index measures performance of the small-cap segment of the U.S. equity universe.
MSCI EAFE Index: Index measures the performance of the large and mid-cap segments of developed markets, excluding the U.S. & Canada.
MSCI EM Index: Index Measures the performance of the large and mid-cap segments of emerging market equities.
Bloomberg US Aggregate Bond Index: Index measures the performance of investment grade, U.S. dollar-denominated, fixed-rate taxable bond market, including Treasuries, government-related and corporate securities, MBS, ABS, and CMBS.
Park Avenue Securities LLC (PAS) is a wholly owned subsidiary of The Guardian Life Insurance Company of America (Guardian). 10 Hudson Yards, New York, NY 10001. PAS is a registered broker-dealer offering competitive investment products, as well as a registered investment advisor offering financial planning and investment advisory services. PAS is a member of FINRA and SIPC.
PAS018129
7069921.18 (Exp. 11/27)