
Monthly Market Commentary - September 2024
Monthly Market Commentary - September 2024
Market Update
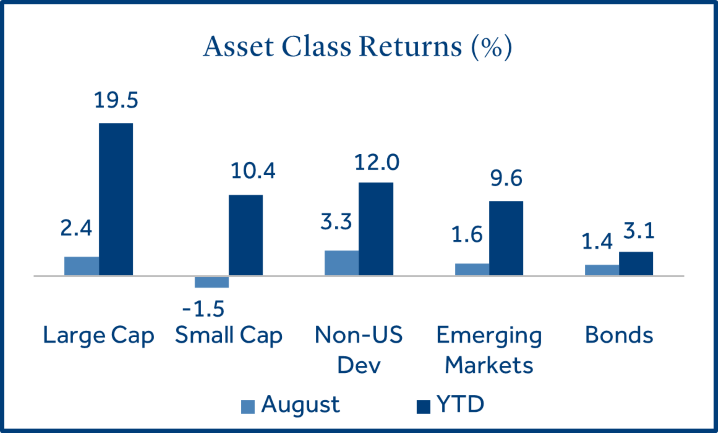
International stocks led positive asset class returns in August.
After a volatile start to August that saw the S&P 500 Index decline -6.1% over the first three trading days, asset classes recovered to be mostly positive for the month. Against this backdrop:
- Large cap stocks overcame a sharp decline in early August to post positive returns: Large caps (S&P 500 Index) gained +2.4% and outperformed small caps (Russell 2000 Index) which lost -1.5% for the month. Following the volatility in early August, large caps rallied on the increasing probability of rate cuts from the Federal Reserve (the Fed) and have returned +19.5% year-to-date.
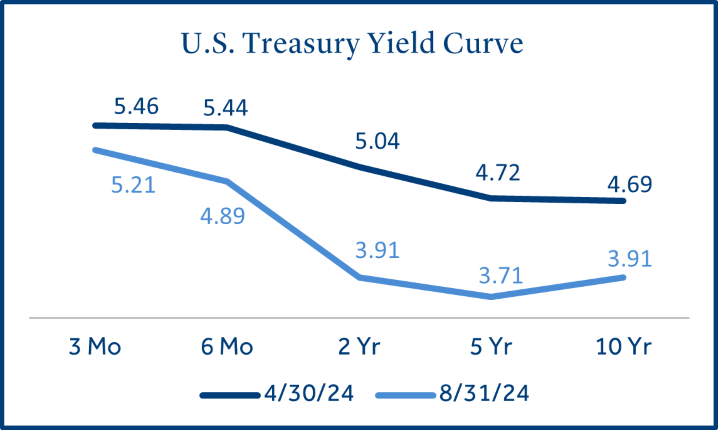
- Bonds posted gains for the fourth straight month: Bonds (Bloomberg US Aggregate Bond Index) returned +1.4% as interest rates moved lower for the fourth consecutive month. The 10-year U.S. Treasury yield declined from 4.09% to 3.91% (-0.18%) in August.
- Non-U.S. developed markets outpaced U.S. and EM stocks: Non-U.S. developed market stocks (MSCI EAFE Index) returned +3.3% and outperformed EM stocks (MSCI EM Index) which gained +1.6%. France, Switzerland, and Germany pushed eurozone stocks higher on the hopes for additional interest rate cuts as well as an economic boost from the Olympics.
U.S. Equities
Investors preferred higher yielding large cap stocks as volatility rose in August
Fears of a recession gripped equity markets in early August as manufacturing activity and new job growth slowed. However, stock market indices were resilient and most ended August with a positive return.
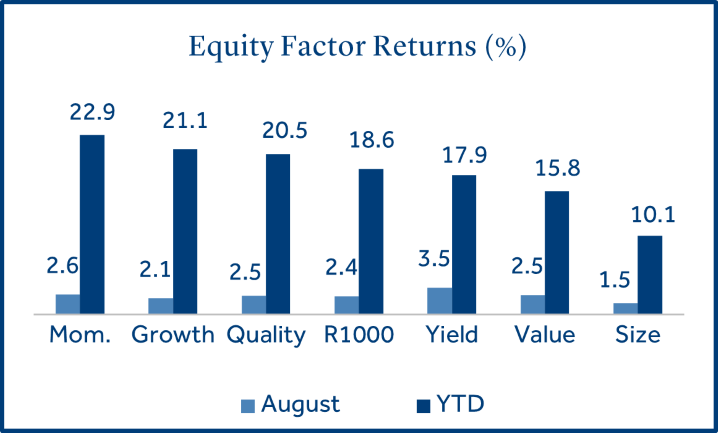
- Small cap stocks take a breather in August: Small capitalization stocks (i.e., the “size factor”) outperformed their larger counterparts in July but slowing economic growth impeded the rally in August. A wide dispersion still exists between recent returns in small and large cap stocks. Small cap stocks equate to 6% of the S&P 500 total market cap, versus 11% historically1.
- Defensive sectors cushioned equity returns: Dividend paying stocks (i.e., the “yield factor”) outperformed during the month as they are often considered a “safe haven” investment when equity markets decline. Additionally, investors may be reallocating to higher yielding stocks on the prospect of lower interest rates.
- Growth stocks still lead value stocks year-to- date: Growth stocks declined -7.3% during the first three trading days of August. However, lower than expected inflation, strong retail sales, and economic friendly commentary from the Fed reignited growth stocks later in the month, which still maintain a sizeable performance advantage versus value stocks in 2024.
Fixed Income
Fixed income sectors continued to benefit from lower Treasury yields.
Moderating economic growth, rising expectations for fed rate cuts, and an increase in market volatility pushed yields lower.
- Long duration bonds outperformed short duration: Although the yield curve remains inverted, it has steepened meaningfully during the four-month period since May. The rapid decline in longer-term yields has been aided by softer economic growth and increasingly “dovish” sentiment from the Federal Reserve.
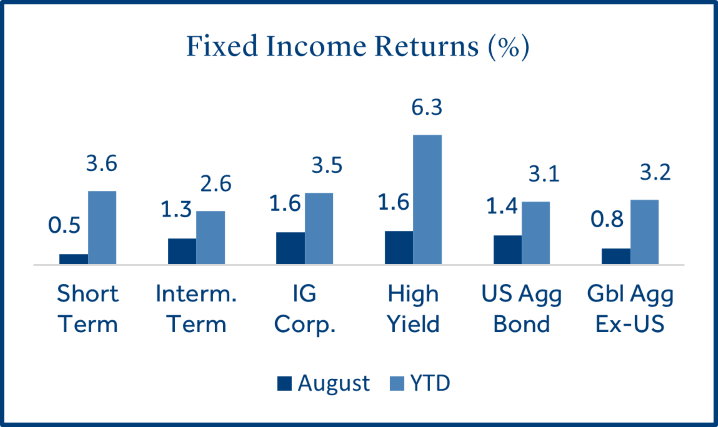
- Investment grade (IG) and high yield (HY) corporate bonds led fixed income returns: IG corporate bonds (rated BBB and above) benefited from a decline in yields while tighter spreads (the yield advantage for corporate bonds above comparable Treasuries) boosted HY bonds. HY spreads are currently at 3.1%, well below the long-term average of 5.0%2.
Market Volatility
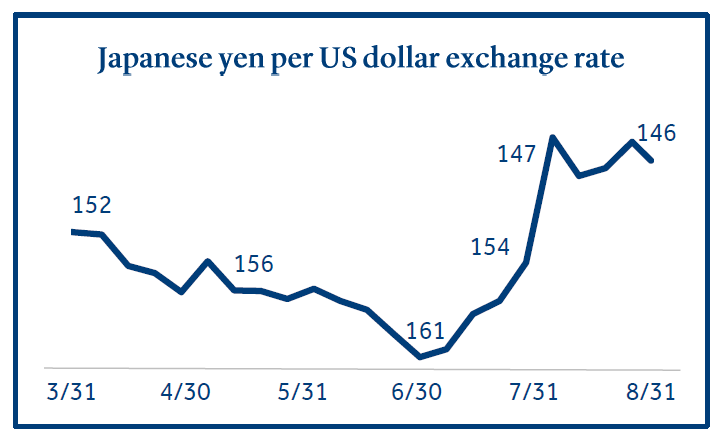
Equity market volatility spiked in early August as Japan’s main stock index declined -12% in one day.
Its widely believed that an investment strategy known as a “carry trade”, where traders take a loan in a country with low interest rates (i.e., Japan) and invest that money in a country with higher interest rates (i.e., U.S.), was to blame for the largest daily decline in Japanese stocks since 1987.
- Japan’s surprise rate hike jolted the yen carry trade: In an act to reverse persistent long-term weakness in the yen, the Bank of Japan (BOJ) raised interest rates to the highest level in 15 years in late July. But this action caused the yen to appreciate more quickly than desired. The rapid increase in the yen’s value required foreign traders with loans in Japan to pay much more to buy yen to repay their loans. This “carry trade” reversal is suspected to have contributed to the run on the yen.
- A volatile yen could create challenges for global markets and the Fed: A stronger yen sparked a sharp selloff in Japanese equities in part due to the country’s heavy reliance on exports. Japan’s stock market is the third largest (by market cap) in the world and its stability is crucial to the health of global capital markets. The U.S. economy will be top of mind when the Fed makes their interest rate decision in September, but caution may be warranted. Lower rates in the U.S. may contribute to further strength in the yen which has the potential to reignite the carry trade unwind.
Federal Reserve
Fed Chair Powell stated “the time has come” for the Fed to lower interest rates.
The Fed held their annual economic symposium in Jackson Hole on August 23. Central bankers, policy makers and economists from around the world were in attendance. Key takeaways include:
- The time has come for Fed policy to adjust: Powell stated, “the direction of travel is clear, and the timing and pace of rate cuts will depend on incoming data, the evolving outlook and the balance of risks.” The Fed iterated they have gained confidence inflation is on a path to 2% and do not welcome any further cooling in the labor market3.
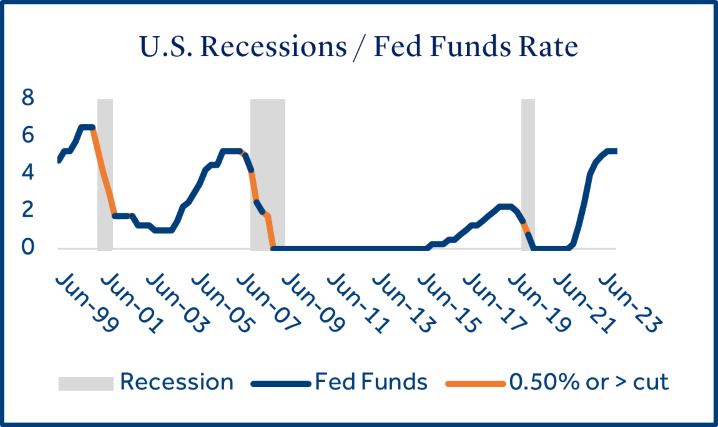
- The Fed would prefer gradual rate cuts: Fed officials stated a desire to begin the process of rate cuts and “keep it moving” at a measured pace. Many economists expect a series of 0.25% cuts if economic data remains supportive. A single cut of 0.50% or greater may suggest the Fed was late in cutting rates, as cuts of 0.50% or more over the past 20 years have only occurred before a recession4 (highlighted in the chart below).
- Global central banks signal further interest rate cuts are likely to occur overseas: The Bank of England lowered rates in August and suggested that further cuts are on the horizon while several European Central Bank officials stated they support another cut in September (following their initial reduction in June).
Economic Calendar
U.S. job growth missed expectations, but consumer spending remained resilient.
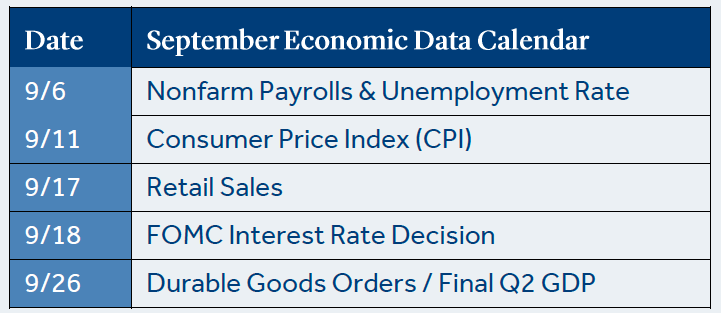
- U.S. job growth decelerated in August: Job growth continued to be positive with +114k new jobs added, but that was well below expectations for +185k. The unemployment rate has for four consecutive months to 4.3%, reaching the highest level since October 2021. Average hourly earnings, a closely watched inflation barometer, increased 3.6% on an annual basis (below forecasts of 3.7%).
- Retail sales accelerated by the most since January 2023: Consumption remained strong and defied predictions by many economists that consumers would rein in spending in the face of higher prices. Retail sales advanced +1.0% for the month, easily topping estimates of +0.3%. The increase in sales was propelled by motor vehicles, electronics, and appliances.
- Annualized inflation (CPI) hits lowest level since 2021: CPI increased +0.2% during July (meeting expectations) and was driven higher by housing-related costs. Annualized inflation was 2.9%, hitting a three-year low. Inflation has declined four straight months since it registered 3.5% in March and has been trending lower for almost two years. With signs the labor market is softening, most market participants think the Fed will cut rates at their September meeting. Interest rate futures currently reflect a 100% probability of a rate cut at that time5.
To download the printable version, CLICK HERE.
Data and rates used were indicative of market conditions as of the date shown. Opinions, estimates, forecasts, and statements of financial market trends are based on current market conditions and are subject to change without notice. This material is intended for general public use and is for educational purposes only. By providing this content, Park Avenue Securities LLC is not undertaking to provide any recommendations or investment advice regarding any specific account type, service, investment strategy or product to any specific individual or situation, or to otherwise act in any fiduciary or other capacity. Please contact a financial professional for guidance and information that is specific to your individual situation. Indices are unmanaged and one cannot invest directly in an index. Links to external sites are provided for your convenience in locating related information and services. Guardian, its subsidiaries, agents, and employees expressly disclaim any responsibility for and do not maintain, control, recommend, or endorse third-party sites, organizations, products, or services and make no representation as to the completeness, suitability, or quality thereof. Past performance is not a guarantee of future results.
Asset class returns sourced from Morningstar Direct. Asset categories listed correspond to the following underlying indices: Large Cap (S&P 500), Small Cap (Russell 2000), Non-US Dev (MSCI EAFE), Emerging Markets (MSCI EM), Bonds (Bloomberg US Aggregate Bond), Mom. (Russell 1000 Momentum Factor), Growth (Russell 1000 Growth), Quality (Russell 1000 Quality Factor), R1000 (Russell 1000), Yield (Russell 1000 Yield Factor), Value (Russell 1000 Value Factor), Size (Russell 1000 Size Factor), Short Term (Bloomberg Short Treasury), Intermediate-term (Bloomberg US Treasury), IG Corp (Bloomberg US Corp. Bond), High Yield (Bloomberg High Yield Corporate), Global Agg ex-US (Bloomberg Global Agg Ex US – Hedged).
Treasury Yields sourced from the U.S. Department of the Treasury. Inflation (CPI) sourced from the U.S. Bureau of Labor Statistics.
Japanese yen per US dollar exchange rate sourced from Bloomberg.
1 Source: Loomis Sayles
2 Source: Charles Schwab
3 Source: Federal Reserve
4 Source: Bloomberg
5 Source: CME FedWatch Tool
The Consumer Price Index (CPI) examines the weighted average of prices of a basket of consumer goods and services, such as transportation, food and medical care and is a commonly used measure of the rate of inflation.
Retail Sales represents the level of retail sales directly to U.S. consumers.
Durable Goods measure the cost of orders received by U.S. manufacturers of goods meant to last at least three years.
Fund Funds Rate: Short-term target interest rate set by the Federal Open Market Committee (FOMC); the policy making committee of the Federal Reserve. It is the interest that banks and other depository institutions lend money on an overnight basis.
S&P 500 Index: Index is generally considered representative of the stock market as a whole. The index focuses on the large-cap segment of the U.S. equities market.
Russell 2000 Index: Index measures performance of the small-cap segment of the U.S. equity universe.
MSCI EAFE Index: Index measures the performance of the large and mid-cap segments of developed markets, excluding the U.S. & Canada.
MSCI EM Index: Index Measures the performance of the large and mid-cap segments of emerging market equities.
Bloomberg US Aggregate Bond Index: Index measures the performance of investment grade, U.S. dollar-denominated, fixed-rate taxable bond market, including Treasuries, government-related and corporate securities, MBS, ABS, and CMBS.
Park Avenue Securities LLC (PAS) is a wholly owned subsidiary of The Guardian Life Insurance Company of America (Guardian). 10 Hudson Yards, New York, NY 10001. PAS is a registered broker-dealer offering competitive investment products, as well as a registered investment advisor offering financial planning and investment advisory services. PAS is a member of FINRA and SIPC.
PAS018141
6979449.1 (Exp. 09/26)

