
Monthly Market Commentary – September 2025
Monthly Market Commentary – September 2025
Market Update
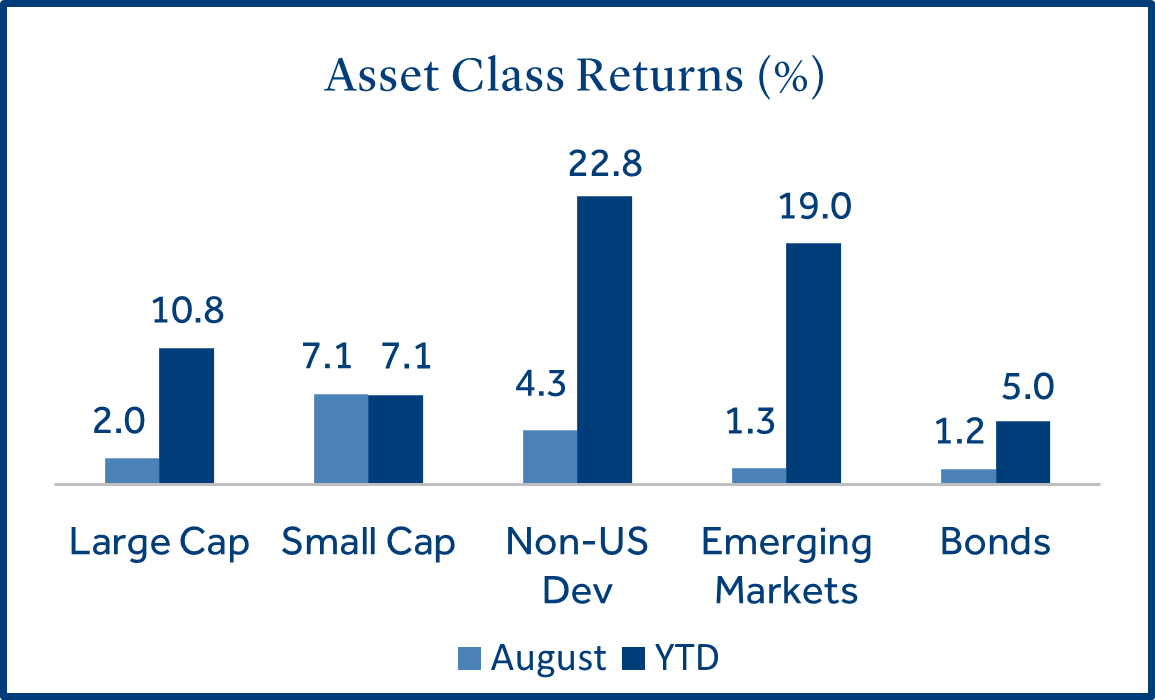
Asset class returns were broadly positive in August as stocks reached new record levels.
The S&P 500 reached a new all-time high in August as a slowdown in new tariff announcements, strong corporate earnings, and continued strength in the artificial intelligence (AI) investment theme propelled stocks higher. Weaker data for jobs rattled equity markets in early August but the Federal Reserve (Fed) took notice and hinted they may cut interest rates as early as September. Against this backdrop:
- Small cap stocks paced asset class returns as expectations of a Fed rate cut increased: Small caps (Russell 2000 Index) gained +7.1% and topped large caps (S&P 500 Index) which returned +2.0%. Generally, small caps benefit more from lower interest rates as they tend to be highly sensitive to borrowing costs and economic activity.
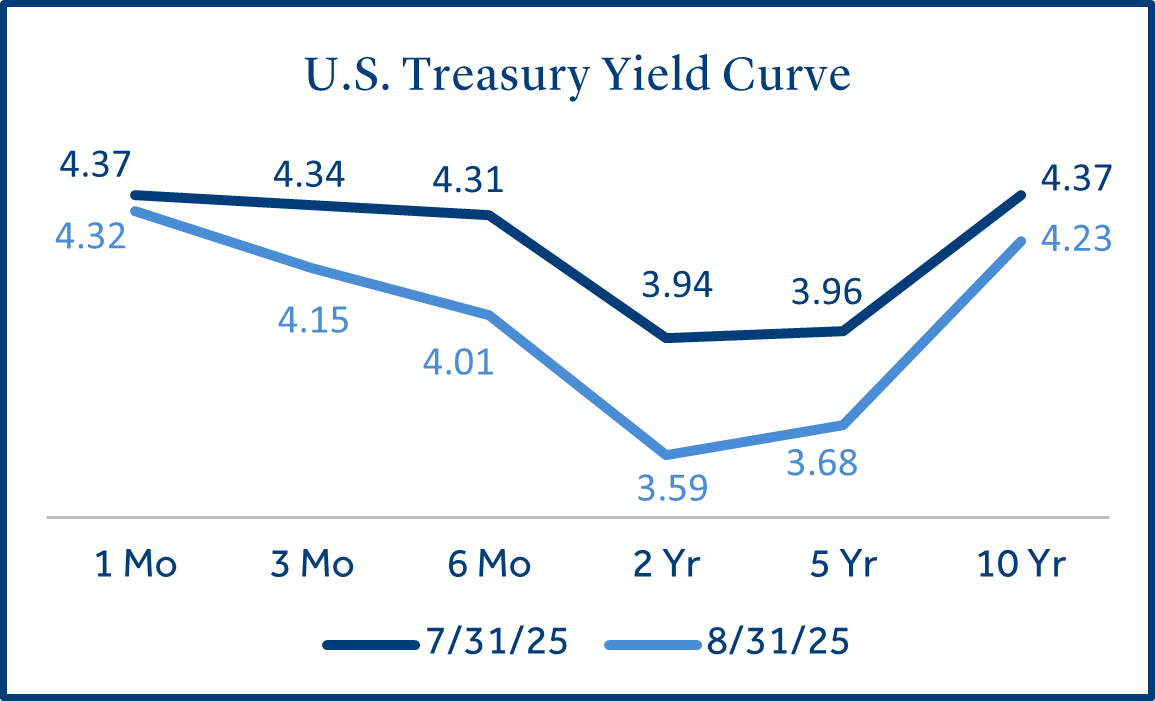
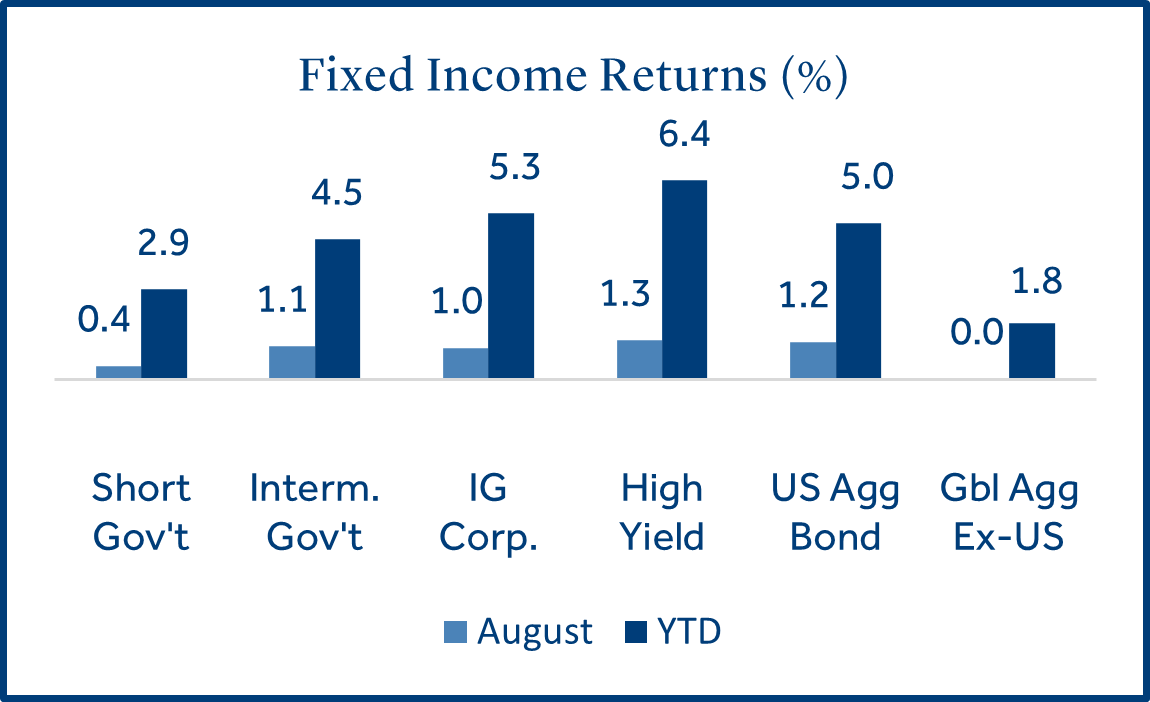
- Bonds posted strong returns as Treasury yields declined: Bonds (Bloomberg U.S. Aggregate Bond Index) returned +1.2% as the 10-year Treasury yield dipped from 4.37% to 4.23%. Mortgage-backed securities (MBS) returned +1.6% and outperformed corporate bonds (+1.0%) and U.S. Treasuries (+1.1%).
- International stocks gained as geopolitical tensions eased: Developed markets (MSCI EAFE Index) gained +4.3% and beat emerging market stocks (MSCI EM Index) which returned +1.3%. Japan (+7.0%) led developed markets higher on strong corporate earnings.
Equities
Small caps led equity market returns, outperforming large caps and international peers.
Domestic stocks gained for the fourth consecutive month as U.S. companies posted strong earnings results and the Fed hinted at potential interest rate cuts during their annual Jackson Hole symposium.
- Small caps have posted strong gains since the stock market correction in April: Small caps have gained +35.1% since the initial tariff pause on April 9th, outgaining U.S. large caps (+30.3%) and international stocks (+24.6%). U.S. small caps returned +3.9% in a single day on August 22nd as the probability of a Fed rate cut increased following a speech by Fed Chair Jerome Powell.
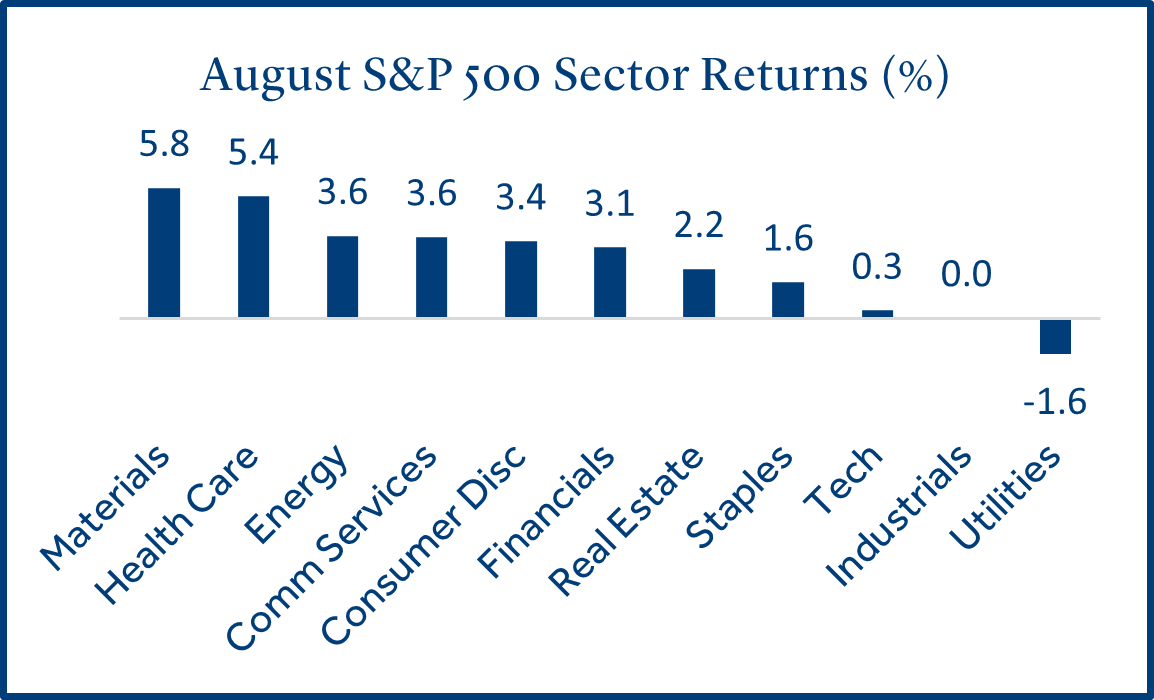
- Health care stocks rebounded after lagging in 2025: Health care is the worst performing sector year-to-date (+0.8%) due to rising costs, policy uncertainty, and stiffening competition. Solid earnings from AbbVie boosted health care stocks as well as investor enthusiasm over news that Warren Buffett’s Berkshire Hathaway initiated a new position in the embattled health insurance provider UnitedHealth Group.
- Value-oriented stocks outgained growth as dividend yield was in favor: Yield was the top performing equity factor (+4.7%) in August as there was a modest rotation out of higher valuation tech stocks. This could indicate some investors re-positioned in higher yielding stocks prior to a potential Fed rate cut in September.
Fixed Income
Bond returns were mostly higher as Treasury yields declined.
Treasury yields drifted lower during the month as labor market growth slowed, inflation accelerated less than expected, and expectations of a Fed rate cut in September increased.
- Shorter-term rates declined more than longer-term rates on the potential for a Fed rate cut: Investor expectations for a -0.25% interest rate cut in September have increased as job growth softened and inflation remained stable in recent months.
- Domestic bonds have outperformed year-to-date as rates remained elevated: U.S. bonds (U.S. Agg Bond Index) have benefitted from a higher rate environment compared to other developed market countries. A resilient U.S. economy has allowed the Fed to manage interest rates in a range of 4.25-4.50% in 2025. Central banks in Europe and Japan have had to deal with slowing growth which has led to more “dovish” interest rate policies.
Commodities
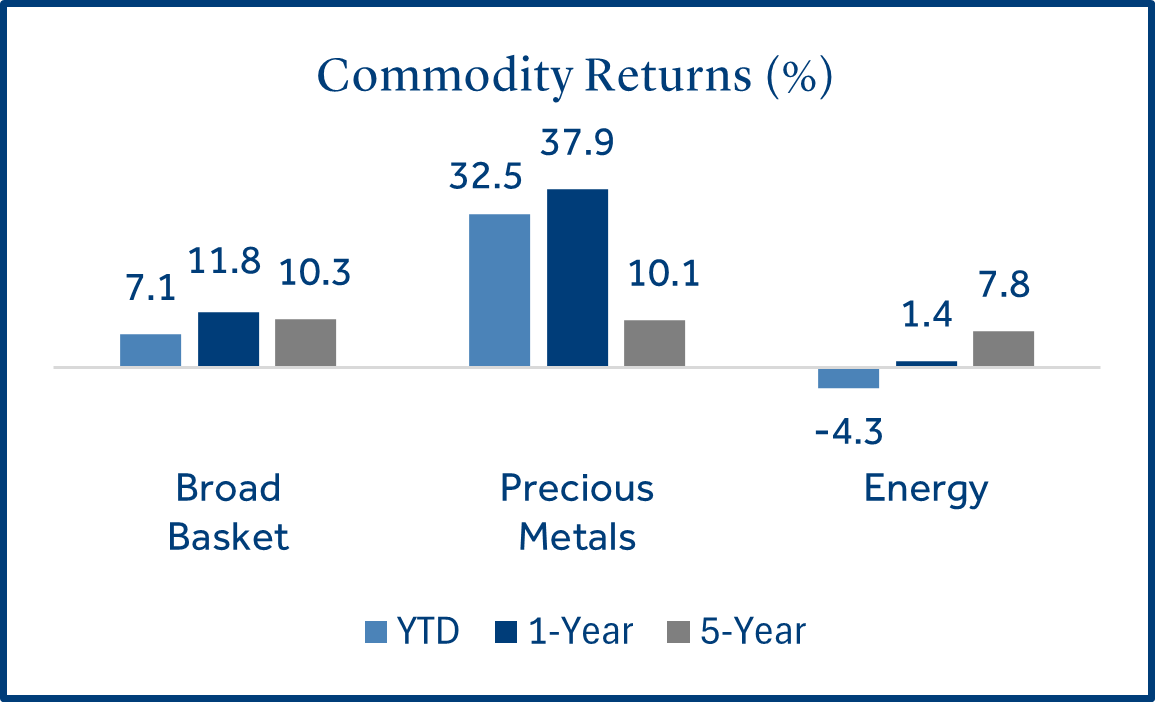
Gold and silver have outperformed traditional asset classes year-to-date.
Commodities are basic goods such as gold, silver, oil, or agricultural products that have a market value which is generally influenced by supply and demand.
- Historically, commodities have exhibited a low correlation to traditional asset classes: Commodities often behave differently than stocks and bonds as their market value is not determined by future cash flows or coupon payments. Rather, the price is driven by supply and demand dynamics and economic factors.
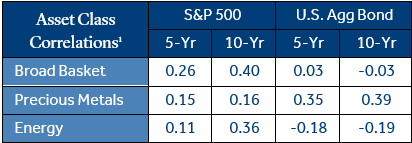
- Precious metals have posted strong gains in 2025 for a variety of reasons: Global central banks have lowered rates in recent years which have often favored non-yielding assets like gold and silver. U.S. inflation has remained above recent historical levels and precious metals are considered to be a traditional inflation hedge. Lastly, geopolitical uncertainty and the size of the U.S. budget deficit have increased investor demand for safe-haven assets. An allocation to commodities may add a differentiated return stream and diversification benefits to a portfolio but there could be a high dispersion of returns across the commodity landscape.
Federal Reserve
The Fed signaled they may cut rates in September amid rising downside risk to employment.
The Fed held their annual economic symposium in Jackson Hole in late August. During the keynote address Fed Chair Powell hinted that the Fed may be on track for a rate cut at their September policy meeting. He reiterated they will continue to be data dependent but cited a “shifting balance of risks” between inflation and employment2.
- Chair Powell’s comments in Jackson Hole may indicate a shift in Fed policy: The Fed acknowledged that recent employment data showed that slowing job growth was “much larger” than assessed a month ago. Although the Fed believes that inflation risks remain “tilted to the upside,” their focus could shift from inflation to employment.
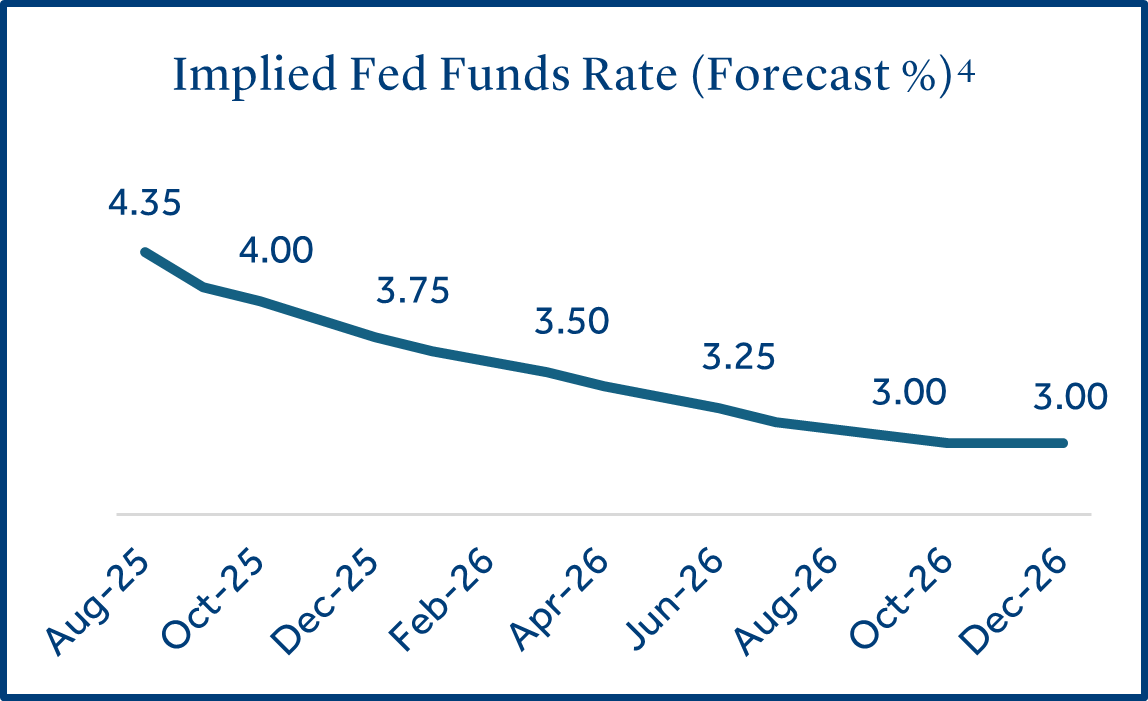
- Investors ratchet up their expectations for interest rate cuts in 2025: Interest rate futures indicate a 90% probability that the Fed will cut rates by -0.25% at their September meeting, up from a 60% probability at the end of July3. The futures market indicates the most likely path for short-term interest rates through year end is for two -0.25% cuts, with the second cut more likely to occur in December (rather than October). Longer-term, market participants (as evidenced by the futures markets) expect short-term interest rates to settle near 3.0% by the close of 2026.
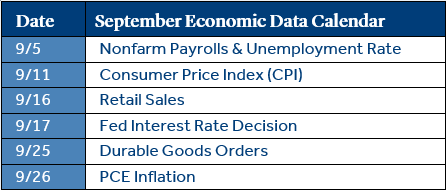
Economic Calendar
U.S. job growth slowed but consumer spending was resilient.
U.S. economic data has provided mixed signals in recent months indicating both resilience and signs of a slowdown. Recent GDP growth (+3.3%) and retail sales exhibited strength but were counterbalanced by soft job growth and lingering inflation. Consumer confidence bounced off the April low but is still well below the 2025 high.
- U.S. job growth slowed in July, and previous data was revised lower: Nonfarm payrolls rose by +73k in July, well below the forecast for +100k. More noteworthy was the total of new jobs created in June and May was revised lower by a total of -258k5. This revision reduced the three-month average to +35k jobs, compared to an average of +123k during the first four months of the year. The unemployment rate inched up (+0.1%) from 4.1% to 4.2%.
- Inflation indicators sent mixed signals in July: CPI inflation held steady from June to July as consumer prices rose +2.7% annually. The producer price index (PPI), which tracks price changes for goods producers at the commercial level increased +3.3% annually. This was well above the forecast for a rise of +2.4% and could indicate inflation is still a threat but has not fully filtered through to consumers.
- Retail sales rose for the second consecutive month: Retail sales increased a solid +0.5% in July following a strong rise in June (+0.9%). Strong demand for automobiles and Amazon Prime promotions helped drive the increase. Solid retail sales helped ease concerns about softening job growth in recent months.
To download the printable version, CLICK HERE.
Data and rates used were indicative of market conditions as of the date shown. Opinions, estimates, forecasts, and statements of financial market trends are based on current market conditions and are subject to change without notice. This material is intended for general public use and is for educational purposes only. By providing this content, Park Avenue Securities LLC is not undertaking to provide any recommendations or investment advice regarding any specific account type, service, investment strategy or product to any specific individual or situation, or to otherwise act in any fiduciary or other capacity. Please contact a financial professional for guidance and information that is specific to your individual situation. Indices are unmanaged and one cannot invest directly in an index. Links to external sites are provided for your convenience in locating related information and services. Guardian, its subsidiaries, agents, and employees expressly disclaim any responsibility for and do not maintain, control, recommend, or endorse third-party sites, organizations, products, or services and make no representation as to the completeness, suitability, or quality thereof. Past performance is not a guarantee of future results.
All investments involve risks, including possible loss of principal. Equities may decline in value due to both real and perceived general market, economic, and industry conditions. Fixed income securities involve interest rate, credit, inflation, and reinvestment risks, and possible loss of principal. As interest rates rise, the value of fixed income securities falls. Low-rated, high yield bonds are subject to greater price volatility. Investing in securities of smaller companies tends to be more volatile and less liquid than securities of larger companies. Investing in foreign securities may involve heightened risk including currency fluctuations, less liquid trading markets, greater price volatility, political and economic instability, less publicly available information and changes in tax or currency laws. Such risks are enhanced in emerging markets.
Asset class returns sourced from Morningstar Direct. Asset categories listed correspond to the following underlying indices: Large Cap (S&P 500), Small Cap (Russell 2000), Non-US Dev (MSCI EAFE), Emerging Markets (MSCI EM), Bonds (Bloomberg US Aggregate Bond), Short Gov’t (Bloomberg Short Treasury), Interm Gov’t (Bloomberg US Treasury), IG Corp (Bloomberg US Corp. Bond), High Yield (Bloomberg High Yield Corporate), Global Agg ex-US (Bloomberg Global Agg Ex US – Hedged), Broad Basket (Bloomberg Commodity / represents precious metals, energy, and agriculture), Precious Metals (Bloomberg Sub Precious Metals / represents gold and silver), Energy (Bloomberg Sub Energy / represents crude oil, natural gas, heating oil, and gasoline).
Treasury Yields sourced from the U.S. Department of the Treasury.
Inflation (CPI) sourced from the U.S. Bureau of Labor Statistics.
Unemployment statistics sourced from the Department of Labor.
1 Source: Morningstar Direct
2 Source: Northern Trust Asset Management
3 Source: CME FedWatch Tool
4 Source: Bloomberg
5 Source: Bureau of Labor Statistics
The Consumer Price Index (CPI) examines the weighted average of prices of a basket of consumer goods and services, such as transportation, food, and medical care, and is a commonly used measure of the rate of inflation.
Retail Sales represents the level of retail sales directly to U.S. consumers.
Durable Goods measure the cost of orders received by U.S. manufacturers of goods meant to last at least three years.
Fed Funds Rate: Short-term target interest rate set by the Federal Open Market Committee (FOMC); the policy making committee of the Federal Reserve. It is the interest that banks and other depository institutions lend money on an overnight basis.
S&P 500 Index: Index is generally considered representative of the stock market as a whole. The index focuses on the large-cap segment of the U.S. equities market.
Russell 2000 Index: Index measures performance of the small-cap segment of the U.S. equity universe.
MSCI EAFE Index: Index measures the performance of the large and mid-cap segments of developed markets, excluding the U.S. & Canada.
MSCI EM Index: Index Measures the performance of the large and mid-cap segments of emerging market equities.
Bloomberg US Aggregate Bond Index: Index measures the performance of investment grade, U.S. dollar-denominated, fixed-rate taxable bond market, including Treasuries, government-related and corporate securities, MBS, ABS, and CMBS.
Park Avenue Securities LLC (PAS) is a wholly owned subsidiary of The Guardian Life Insurance Company of America (Guardian). 10 Hudson Yards, New York, NY 10001. PAS is a registered broker-dealer offering competitive investment products, as well as a registered investment advisor offering financial planning and investment advisory services. PAS is a member of FINRA and SIPC.
PAS12603
7069921.15 (Exp. 8/27)